
Executive Summary
Kerala has long been regarded as an economic paradox within India. The state records some of the country’s highest labour wages while simultaneously imposing one of the highest tax burdens on alcoholic beverages. This has given rise to a widely held public perception that Kerala’s expensive liquor compels workers to demand higher wages, thereby increasing the cost of labour-intensive services across the state. Despite the frequency with which this argument is advanced in public discourse, there has been little empirical evidence to examine whether such a relationship actually exists.
This study investigates that proposition through a comparative analysis of Kerala, Tamil Nadu, Karnataka and Telangana over the period 2023–24 to 2025–26. Secondary data were compiled on construction labour wages, retail prices of four commonly consumed budget liquor brands, representative urban service costs and state alcohol taxation structures. To evaluate affordability rather than merely comparing prices, three analytical indicators were developed:
- Liquor Affordability Ratio (LAR) – the proportion of a worker’s daily wage required to purchase a standard 180 ml bottle of liquor.
- Evening Leisure Cost Index (ELCI) – the proportion of daily earnings required to meet a typical evening’s discretionary expenditure, including liquor, refreshments and essential incidental expenses.
- Alcohol Tax Burden Index (ATBI) – the proportion of the retail liquor price attributable to taxation and statutory levies.
Together, these indicators provide a more comprehensive measure of affordability than retail prices alone.
Key Findings
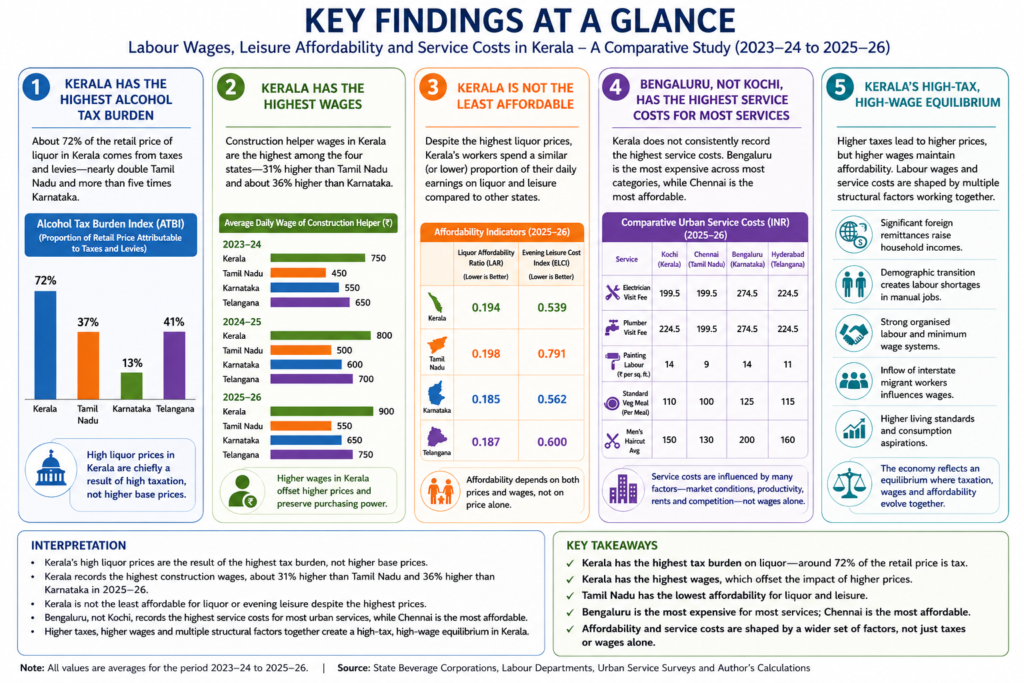
The study confirms that Kerala imposes the highest alcohol tax burden among the four states. Approximately 72% of the retail price of the selected liquor brands consists of taxes and statutory levies, compared with 41% in Telangana, 37% in Tamil Nadu and only 13% in Karnataka. The evidence therefore establishes that Kerala’s comparatively high retail liquor prices are primarily the result of fiscal policy rather than higher production or distribution costs.
However, higher retail prices do not translate into the greatest affordability burden. The Liquor Affordability Ratio demonstrates that Kerala’s comparatively higher labour wages substantially offset the effect of higher liquor prices. Although workers in Kerala pay more in absolute terms for alcohol, they devote a proportion of daily earnings that is broadly comparable with workers in neighbouring states and, in several cases, lower than workers in Tamil Nadu.
The Evening Leisure Cost Index similarly indicates that Kerala’s workers do not experience the highest overall burden of discretionary evening expenditure. While leisure costs are higher in monetary terms, relatively higher wages preserve purchasing power. Karnataka records the greatest affordability, whereas Tamil Nadu consistently records the lowest.
The comparison of representative urban service costs reveals a further important finding. Contrary to common perception, Kerala does not consistently exhibit the highest service costs. Bengaluru records the highest prices for most of the selected services, while Kochi’s service costs remain broadly comparable with Hyderabad and only moderately higher than Chennai. These observations suggest that labour wages alone do not fully explain differences in service pricing.
Interpretation
The integrated analysis indicates that alcohol taxation clearly explains Kerala’s higher retail liquor prices but does not, by itself, explain the state’s comparatively high labour wages or service costs. Instead, the findings are consistent with a broader structural interpretation in which labour market outcomes are shaped by multiple interacting factors, including foreign remittances, demographic transition, labour shortages, organised labour and interstate migration.
The study therefore identifies what may be described as a high-tax, high-wage equilibrium. In this equilibrium, higher alcohol taxation increases retail liquor prices, while comparatively higher wages preserve affordability. Service costs, meanwhile, are influenced by a wider combination of labour costs, market conditions, productivity, urban operating expenses and commercial factors.
Evaluation of the Research Hypothesis
The findings provide partial support for the study’s alternative hypothesis. The evidence clearly supports the proposition that higher alcohol taxation is associated with higher retail liquor prices. However, it does not establish that alcohol taxation alone is responsible for higher labour wages or urban service costs. Rather, these outcomes appear to emerge from a complex interaction of fiscal, demographic and labour-market factors.
Policy Implications
The study highlights the importance of evaluating taxation policies through the broader concept of affordability rather than retail prices alone. Comparisons based solely on liquor prices can be misleading because they ignore differences in labour incomes and purchasing power. The analytical framework developed in this research—the Liquor Affordability Ratio (LAR), Evening Leisure Cost Index (ELCI) and Alcohol Tax Burden Index (ATBI)—offers practical tools for assessing the combined effects of taxation, wages and affordability and may be useful for future policy evaluation and comparative research.
Conclusion
The principal contribution of this study is not that it proves alcohol taxation causes higher wages, but that it demonstrates the relationship is considerably more complex than commonly assumed. Kerala’s experience reflects the interaction of fiscal policy with labour markets, demographic change, remittance-supported household incomes and migration rather than a simple cause-and-effect relationship. By shifting the focus from retail prices to affordability, the study provides a more balanced understanding of the economic consequences of alcohol taxation and contributes a structured analytical framework for future research on taxation, labour markets and household welfare.
| Contents | |
| 1 Introduction 2 Literature Review. 2.1 The Cost-of-Living Transmission Channel and Wage-Push Inflation 2.2 Comparative Regional Dynamics 2.3 Fiscal Policy, Labour Markets and Service Inflation 2.4 Demographic Transition and Labour Market Tightness 2.5 Interstate Migration and Wage Arbitrage 2.6 Other Structural Determinants of Service Costs 3 Research Gap 4 Aim of the Study, Research Objectives and Hypothesis 4.1 Aim of the Study 4.2 Research Objectives 4.3 Research Question 4.4 Research Proposition and Working Hypothesis 5. Conceptual Framework 5.1 Expected Relationships Examined 6. Methodology 6.1 Research Design 6.2 Study Variables 6.3 Data Collection 6.4 Data Processing 6.5 Development of Analytical Indicators 6.6 Analytical Approach 6.7 Limitations of the Study 7. Comparative Analysis 7.1 Labour Wages 7.2 Retail Liquor Prices 7.3 Liquor Affordability Ratio (LAR) 7.4 Evening Leisure Cost Index 7.5 Urban Service Costs | 7.6 Alcohol Tax Burden 7.7 Integrated Comparative Analysis 8. Integrated Discussion 8.1 Why Are Retail Liquor Prices Highest in Kerala? 8.2 Does Higher Price Necessarily Mean Lower Affordability? 8.3 Is Evening Leisure Beyond the Reach of the Average Worker? 8.4 Do Higher Wages Automatically Produce Higher Service Costs? 8.5 Revisiting the Original Hypothesis 8.6 Kerala’s High-Tax, High-Wage Equilibrium 9. Policy Implications 9.1 Alcohol Taxation Should Be Evaluated in a Broader Economic Context 9.2 Affordability Is a More Meaningful Indicator Than Price Alone 9.3 Labour Market Policies Must Recognise Structural Influences 9.4 Service Cost Inflation Requires a Multi-Dimensional Policy Response 9.5 Planning for Kerala’s Changing Labour Market 9.6 Evidence-Based Policy Evaluation 10. Limitations of the Study 10.1 Limited Geographic Coverage 10.2 Urban Representation of Service Costs 10.3 Limited Product Coverage 10.4 Representative Occupational Group 10.5 Time Period of Analysis 10.6 Data Availability 10.7 Interpretation of Economic Relationships 10.8 Structural Complexity 11. Future Research 12. Conclusion |
1. Introduction
Kerala presents a distinctive economic paradox within India. It combines some of the country’s highest labour wages with one of the highest tax burdens on alcoholic beverages, while simultaneously experiencing extensive inward migration of manual labour from other states. Retail prices of Indian-Made Foreign Liquor (IMFL) in Kerala are among the highest in the country, largely because of the state’s taxation policy. This has given rise to a widely held perception that the higher cost of alcohol increases the cost of living for regular consumers, encouraging workers to seek higher wages in order to preserve their purchasing power and, in turn, contributing to higher service costs.
At the same time, Kerala’s labour market is shaped by several other structural factors, including sustained inflows of foreign remittances, labour shortages arising from demographic transition, organised labour, and significant interstate migration of workers. These factors make it difficult to isolate the contribution of alcohol taxation to labour wage formation and service costs.
Despite the frequency with which this relationship is discussed in public discourse, there has been little empirical effort to examine it using comparative data. This study seeks to address that gap by comparing labour wages, liquor prices, liquor affordability, evening leisure affordability, urban service costs, and alcohol taxation across Kerala, Tamil Nadu, Karnataka, and Telangana during the period 2023–24 to 2025–26. These four southern states share broadly comparable socioeconomic characteristics and labour markets, while differing significantly in their alcohol taxation policies, making them suitable for a comparative assessment of the relationship between taxation, affordability, wages, and service costs.
2. Literature Review
Factors Influencing Labour Wages and Service Costs in Kerala
Kerala’s comparatively high labour wages and service costs have attracted considerable attention from economists, policymakers and the public. Previous studies and policy discussions suggest that these outcomes are shaped by a combination of fiscal policies, demographic changes, labour market dynamics and external income flows. The following factors are frequently cited in the literature as possible explanations.
2.1 The Cost-of-Living Transmission Channel and Wage-Push Inflation
Kerala imposes one of the highest tax burdens on Indian-Made Foreign Liquor (IMFL), resulting in retail liquor prices that are among the highest in India. Since alcohol consumption among regular daily wage earners is often regarded as relatively price inelastic, higher taxation can increase discretionary household expenditure for habitual consumers. One frequently cited argument is that this additional expenditure encourages workers to seek higher wages in order to preserve their purchasing power. Where employers accommodate these wage expectations, labour-intensive sectors may experience wage-push inflation, with higher labour costs eventually being reflected in the prices of services. Whether this transmission mechanism operates to a measurable extent in Kerala is one of the principal questions examined in the present study.
2.2 Comparative Regional Dynamics
2.2 Comparative Regional Dynamics
Foreign remittances resulting from the long-standing migration of Keralites to the Gulf countries have been one of the defining characteristics of Kerala’s economy for several decades. Numerous studies have shown that remittance income has significantly influenced household incomes, consumption patterns and reservation wages within the state. The sustained inflow of external income has increased aggregate demand and strengthened the bargaining position of workers in the domestic labour market. It has also contributed to a relatively high standard of living compared with many other Indian states. Some researchers argue that when this structural wage premium coincides with high taxation on consumer goods such as alcohol, the overall cost of living may remain elevated relative to neighbouring southern states.
2.3 Fiscal Policy, Labour Markets and Service Inflation
Another perspective emphasises the interaction between fiscal policy and labour market institutions. High taxation on consumer goods does not necessarily reduce consumption; instead, it may increase household expenditure on regularly consumed items, thereby influencing wage expectations. Kerala’s long tradition of organised labour and collective bargaining may reinforce these expectations, although the relationship is mediated by broader institutional and economic conditions. Since many service industries—particularly construction, logistics, maintenance and personal services—are highly labour intensive and have limited opportunities for productivity gains through automation, increases in labour costs are more likely to be reflected in service prices than in manufacturing industries. [1]
2.4 Demographic Transition and Labour Market Tightness
Kerala’s advanced demographic transition represents another important structural factor. The state has one of India’s lowest fertility rates and one of its fastest ageing populations. At the same time, high literacy and educational attainment have encouraged many younger workers to pursue higher education, white-collar employment or overseas migration rather than manual occupations. The resulting shortage of local workers in construction and other labour-intensive sectors has contributed to sustained upward pressure on wages. This demographic mechanism operates independently of alcohol taxation but may interact with other economic factors in influencing labour costs. [2,3, 4, 5, 6,7]
2.5 Interstate Migration and Wage Arbitrage
The shortage of local manual labour has encouraged substantial interstate migration into Kerala, particularly from eastern and northern Indian states such as West Bengal, Bihar and Assam. Drawn by significantly higher daily wages than those available in their home states, migrant workers have become an essential component of Kerala’s construction and service sectors. While this migration has alleviated labour shortages, it has not necessarily reduced prevailing wage levels. Migrant workers must also adapt to Kerala’s relatively higher cost of living, including housing, food and other consumption expenses. Consequently, interstate migration appears to have stabilised the labour market without fundamentally altering the state’s higher wage equilibrium. [8, 9, 10]
2.6 Other Structural Determinants of Service Costs
The literature further suggests that Kerala’s comparatively high service costs cannot be attributed to any single factor, but other influences viz:
- Strong labour unionisation and collective bargaining traditions.
- High urban land values and commercial real estate costs.
- Demographic changes that reduce the availability of local manual labour.
- Sustained inflows of foreign remittances that support household purchasing power and reservation wages.
- Labour shortages in several service-oriented sectors.
Taken together, these factors indicate that Kerala’s service-cost structure is shaped by a complex interaction of fiscal, demographic, institutional and labour-market forces. Although high taxation on alcoholic beverages undoubtedly contributes to the cost of living for regular consumers, the existing literature suggests that it is only one component of a much broader economic system. The present study therefore seeks to examine the specific contribution of alcohol taxation by comparing labour wages, liquor affordability, urban service costs and taxation across Kerala, Tamil Nadu, Karnataka and Telangana.
3. Research Gap
The relationship between alcohol taxation and public health has been widely examined in the economic and public policy literature, with most studies focusing on its effects on alcohol consumption, government revenue, and health outcomes. Comparatively little attention, however, has been given to the broader economic implications of alcohol taxation, particularly its potential influence on labour wages, consumer affordability, and the pricing of labour-intensive services.
In Kerala, it is frequently argued in public discourse that the state’s high taxation on alcoholic beverages contributes to higher wage expectations and, consequently, higher service costs. Despite the prevalence of this perception, there is limited empirical evidence to evaluate whether such a relationship exists or to distinguish the influence of alcohol taxation from other structural factors such as foreign remittances, labour shortages, demographic transition, organised labour, and interstate migration.
Furthermore, no comparable interstate study has systematically examined the interaction between alcohol taxation, liquor affordability, evening leisure affordability, labour wages, and urban service costs using a common analytical framework.
This study seeks to address that gap through a comparative analysis of Kerala, Tamil Nadu, Karnataka, and Telangana during the period 2023–24 to 2025–26 by developing and applying the Liquor Affordability Ratio (LAR), Evening Leisure Cost Index (ELCI), and Alcohol Tax Burden Index (ATBI). In doing so, it aims to provide an evidence-based assessment of whether Kerala’s higher alcohol taxation is associated with a distinctive high-tax, high-wage economic equilibrium.
4. Aim of the Study, Research Objectives and Hypothesis
4.1 Aim of the Study
The primary aim of this study is to examine whether Kerala’s relatively high taxation on alcoholic beverages is associated with labour wages, leisure affordability and urban service costs when compared with neighbouring southern states. By integrating data on alcohol taxation, retail liquor prices, labour wages and selected service costs, the study seeks to understand how these factors interact within Kerala’s broader economic environment.
4.2 Research Objectives
The specific objectives of the study are to:
1. Compare construction labour wages in Kerala, Tamil Nadu, Karnataka and Telangana during the period 2023–24 to 2025–26.
2. Compare the retail prices of selected budget alcoholic beverages across the four states.
3. Measure and compare liquor affordability using the **Liquor Affordability Ratio (LAR)**.
4. Measure and compare the affordability of a typical evening’s discretionary expenditure using the **Evening Leisure Cost Index (ELCI)**.
5. Compare representative urban service costs across the four states.
6. Examine differences in the alcohol tax burden using the **Alcohol Tax Burden Index (ATBI)**.
7. Assess whether the observed evidence supports an association between alcohol taxation, labour wages, affordability and urban service costs.
4.3 Research Question
The central research question addressed in this study is:
“Does Kerala’s relatively high taxation on alcoholic beverages have a measurable association with labour wages, leisure affordability and urban service costs when compared with neighbouring southern states? “
4.4 Research Proposition and Working Hypothesis
The study evaluates the following hypotheses:
Null Hypothesis (H₀):
There is no significant association between Kerala’s higher alcohol taxation and labour wages, leisure affordability or observed urban service costs when compared with neighbouring southern states.
Alternative Hypothesis (H₁):
Kerala’s higher alcohol taxation is associated with higher retail liquor prices and may influence labour wages, leisure affordability and observed urban service costs, although these relationships may also be affected by broader structural factors such as remittances, labour shortages, demographic transition and interstate migration.
5. Conceptual Framework
Figure 1 presents the conceptual framework that underpins this study. It recognises that labour wages and service costs in Kerala are influenced by multiple interacting structural factors rather than by alcohol taxation alone. Previous literature suggests that fiscal policy, foreign remittances, demographic transition, labour shortages and interstate migration collectively shape reservation wages, labour market dynamics and the pricing of labour-intensive services.
The upper portion of the framework summarises these theoretical relationships as identified in the literature and public policy discourse. It illustrates how higher alcohol taxation may increase retail liquor prices and discretionary living costs, while simultaneously recognising that labour market outcomes are also influenced by structural economic and demographic factors.
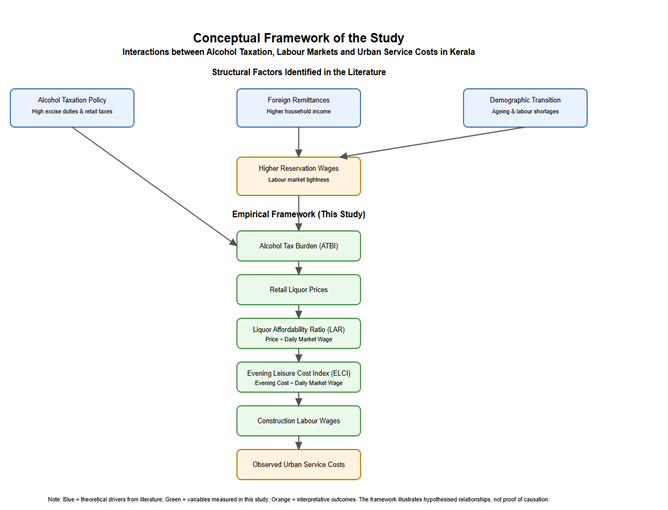
Figure 1. Conceptual Framework of the Study
The lower portion of the framework represents the empirical model adopted in this study. Rather than attempting to test every theoretical pathway, the study focuses on variables that can be directly measured and compared across states. Specifically, it examines alcohol taxation through the Alcohol Tax Burden Index (ATBI), retail liquor prices, liquor affordability through the Liquor Affordability Ratio (LAR), evening leisure affordability through the Evening Leisure Cost Index (ELCI), construction labour wages and observed urban service costs. These variables are analysed to determine whether Kerala’s relatively high alcohol taxation is associated with measurable differences in affordability, wages and service costs when compared with neighbouring southern states.
The conceptual framework is intended to guide the interpretation of the empirical findings. It illustrates hypothesised economic relationships based on existing literature and should not be interpreted as evidence of direct causation. The conclusions of this study are therefore presented as observed economic associations within the limitations of the available data.
5.1 Expected Relationships Examined
| Relationship Examined | Expected Relationship | Examined in this Study |
| Higher alcohol taxation → Higher retail liquor prices | Positive | ✓ |
| Higher retail liquor prices → Higher Liquor Affordability Ratio (LAR) | Positive | ✓ |
| Higher labour wages → Lower Liquor Affordability Ratio (LAR) | Negative | ✓ |
| Higher labour wages → Lower Evening Leisure Cost Index (ELCI) | Negative | ✓ |
| Higher labour wages → Higher observed urban service costs | Positive (expected) | ✓ |
| Higher alcohol taxation → Higher labour wages | Indirect and exploratory | Partially examined |
6. Methodology
6.1 Research Design
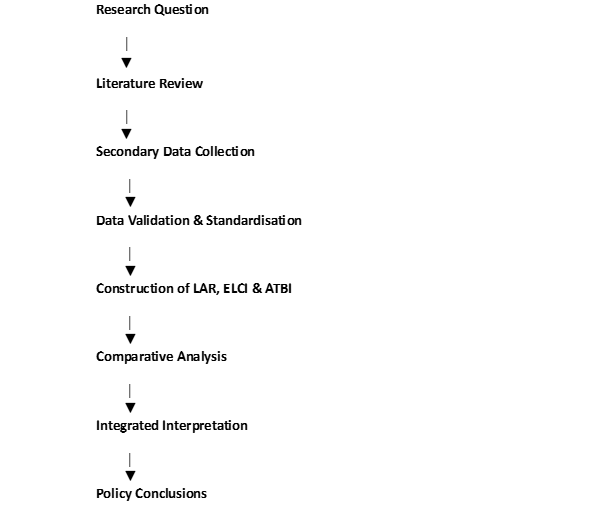
This study adopts a comparative descriptive research design to examine whether Kerala’s relatively high taxation on alcoholic beverages is associated with higher labour wages, leisure affordability, and labour-intensive service costs when compared with neighbouring southern states. Rather than attempting to establish a direct causal relationship, the study investigates whether observable patterns of affordability and pricing support or contradict the commonly held perception that Kerala’s expensive liquor contributes to higher wage expectations.
The study compares four southern Indian states—Kerala, Tamil Nadu, Karnataka, and Telangana—over a three-year period covering the financial years 2023–24, 2024–25, and 2025–26. These states were selected because they share similar climatic conditions, cultural familiarity with alcohol consumption, comparable construction sectors, and relatively developed urban economies, while exhibiting markedly different alcohol taxation policies.
6.2 Study Variables
The study examines four interrelated groups of variables representing labour markets, consumer affordability, urban service costs and fiscal policy. Together, these variables provide a framework for analysing the relationship between alcohol taxation, purchasing power and labour-intensive service costs.
The study focuses on four interconnected dimensions:
- Construction labour wages.
- Retail prices of commonly consumed budget alcoholic beverages.
- Cost of selected labour-intensive urban services.
- State-specific alcohol taxation structures.
Together, these variables enable an examination of the relationship between alcohol taxation, consumer affordability, labour income, and the broader cost of everyday services.
| Dataset | Variables | Source |
| Liquor Prices | 180 ml retail prices of four selected brands | BEVCO, TASMAC, KSBC, Telangana Beverages Corporation |
| Urban Service Costs | Electrician, plumber, haircut, painting, veg meal | Public service platforms, published price lists |
| Labour Wages | Construction helper, mason, carpenter, electrician, plumber. | State Labour Departments |
| Alcohol Taxation | Excise duty, sales tax, statutory levies | State Excise Departments / Beverage Corporations |
6.3 Data Collection
The study relies primarily on secondary data obtained from official government notifications, state beverage corporations, labour department publications and publicly available service-price platforms. Wherever multiple sources were available, the most recent official or publicly verifiable information corresponding to each financial year was adopted.
The principal datasets compiled for this study include:
(a) Construction Labour Wages
Minimum wages for construction workers were compiled from notifications issued by the Labour Departments of Kerala, Tamil Nadu, Karnataka, and Telangana. Where available, prevailing market wages were also considered to ensure that affordability calculations reflected actual labour-market conditions rather than statutory minima alone.
The occupational categories considered include:
- Construction helper
- Mason
- Carpenter
- Painter
- Electrician
- Plumber
For affordability calculations, the prevailing daily wage of a construction helper was used as the representative wage of an entry-level worker.
(b) Liquor Prices
Retail prices of four widely available budget liquor brands were collected for each of the four states.
The selected brands satisfy the following criteria:
- Availability across all four states.
- Popularity among working-class consumers.
- Availability in the standard 180 ml retail pack.
- Consistent market presence during the study period.
(c) Urban Service Costs
To understand whether higher labour wages are reflected in the cost of everyday services, representative prices were collected for the following labour-intensive services:
- Electrician service visit
- Plumber service visit
- House painting labour
- Standard vegetarian meal
- Men’s haircut
Because comparable statewide service-price databases are unavailable in India, the study uses representative prices from the principal metropolitan city of each state:
- Kochi (Kerala)
- Chennai (Tamil Nadu)
- Bengaluru (Karnataka)
- Hyderabad (Telangana)
These observations are intended to represent urban cost structures rather than statewide averages.
(d) Alcohol Tax Structure
Information on alcohol taxation was collected from official beverage corporations and state excise notifications. Where detailed price structures were available, the study identified the approximate proportion of the retail price attributable to taxation and statutory levies.
6.4 Data Processing
Before analysis, all datasets were standardised to ensure consistency across states and years. Labour wages were converted to daily market wage equivalents where necessary, liquor prices were normalised to the 180 ml retail pack, and service costs were expressed in Indian Rupees for representative urban locations. The datasets were compiled in CSV format and subsequently processed to derive the analytical indicators used in the study. Data validation included checks for missing values, consistency of units and arithmetic verification of derived affordability ratios.
6.5 Development of Analytical Indicators
Instead of relying solely on absolute prices or wages, the study develops three affordability indicators to measure the economic burden on workers.
Liquor Affordability Ratio (LAR)
The Liquor Affordability Ratio measures the proportion of a worker’s daily wage required to purchase a standard 180 ml bottle of liquor.
LAR=Average Retail Price of 180 ml Liquor/Daily Market Wage
Unlike absolute liquor prices, the Liquor Affordability Ratio incorporates both retail price and labour income, thereby providing a direct measure of purchasing power. A lower LAR indicates that a worker can purchase the same quantity of liquor with a smaller proportion of daily earnings. A higher value indicates lower affordability.
Evening Leisure Cost Index (ELCI)
The Evening Leisure Cost Index estimates the proportion of daily earnings required to finance a typical evening’s discretionary expenditure, including liquor and selected accompanying expenses
ELCI=Total Evening Leisure Cost/Daily Market Wage
The Evening Leisure Cost Index extends the affordability concept beyond alcohol alone by incorporating representative discretionary expenditure associated with an evening outing. It therefore provides a broader measure of leisure affordability than retail liquor prices.
Alcohol Tax Burden Index (ATBI)
The Alcohol Tax Burden Index estimates the proportion of the retail liquor price attributable to taxation.
ATBI=Estimated Tax Component/Retail Price
The index provides an indication of the extent to which government taxation contributes to retail liquor prices. The Alcohol Tax Burden Index isolates the contribution of state taxation to the retail price of alcoholic beverages and enables interstate comparison of fiscal policy intensity independent of the manufacturer’s base price.
6.6 Analytical Approach
The analysis proceeds in four stages.
First, descriptive statistics are used to compare labour wages, liquor prices, affordability indices and service costs across the four study states.
Second, interstate comparisons are undertaken to identify differences in labour wages, liquor affordability, leisure affordability and taxation.
Third, the three analytical indicators (LAR, ELCI and ATBI) are interpreted collectively to assess the relationship between alcohol taxation, affordability and labour market outcomes.
Finally, the findings are synthesised to evaluate the research hypothesis. Because the study comprises four states over a three-year period, the analysis is descriptive and comparative in nature. The results are interpreted as evidence of economic association rather than proof of direct causation.
Given the limited sample size (four states over three years), the study does not attempt to establish statistical causality. Instead, it focuses on identifying meaningful patterns and associations that may inform broader discussions on taxation, labour markets, and affordability.
6.7 Limitations of the Study
Several limitations should be acknowledged.
The service-cost dataset is based on representative metropolitan cities rather than statewide averages. While Kochi is considered broadly representative of urban Kerala because of the state’s relatively compact geography and high degree of urbanisation, Bengaluru, Chennai, and Hyderabad may not fully represent the average service costs prevailing throughout Karnataka, Tamil Nadu, and Telangana. Consequently, comparisons relating to service costs should be interpreted as urban comparisons rather than statewide estimates.
Similarly, the study examines only four commonly consumed budget liquor brands and a limited number of labour-intensive services. These were selected to ensure comparability across states and to reflect typical working-class consumption patterns.
Finally, although the study identifies associations between taxation, affordability, wages, and service costs, it does not claim that alcohol taxation alone determines labour-market outcomes. Wage levels are influenced by numerous factors, including labour shortages, migration, productivity, unionisation, economic growth, and regional cost-of-living differences. The findings should therefore be interpreted as evidence of economic relationships rather than proof of direct causation.
7. Comparative Analysis
This chapter presents a comparative analysis of labour wages, retail liquor prices, affordability indicators, urban service costs and alcohol taxation across Kerala, Tamil Nadu, Karnataka and Telangana for the period 2023–24 to 2025–26. The objective is not merely to compare absolute values but to understand how differences in taxation, wages and affordability interact within each state’s labour market. The analysis proceeds from basic descriptive comparisons to the interpretation of the three analytical indicators developed for this study, namely the Liquor Affordability Ratio (LAR), the Evening Leisure Cost Index (ELCI) and the Alcohol Tax Burden Index (ATBI).
7.1 Construction Labour Wages
Most economic studies assume that wages are driven by productivity, labour scarcity, skill, inflation, unionization. But in Kerala there may be another factor about standard of living. One possible explanation is that workers seek wages that support a socially accepted standard of living, which may include discretionary expenditure on leisure in addition to basic necessities.
mason in Kochi may expect:
- evening tea,
- cigarettes,
- occasional bar visits,
- daily 180 ml consumption,
- mobile recharge,
- cable TV,
- motorcycle expenses,
whereas a worker in another state may have a different expenditure pattern.
The wage demanded is often related to the expected standard of living, not merely biological survival.
In Kerala, the minimum daily wages for construction and building workers—regulated under the Minimum Wages Act—start at ₹730 for unskilled workers and range up to ₹940 for highly skilled workers. Because Kerala periodically adjusts these rates using a Variable Dearness Allowance (VDA) tied to inflation, actual market wages often range between ₹800 to ₹1,200+ per day depending on the specific location
Labour wages (in Rs).
| State | 2023–24 | 2024–25 | 2025–26 |
| Kerala | 750 | 800 | 900 |
| Karnataka | 750 | 800 | 850 |
| Telangana | 650 | 700 | 750 |
| Tamil Nadu | 600 | 650 | 700 |
Table 7.1
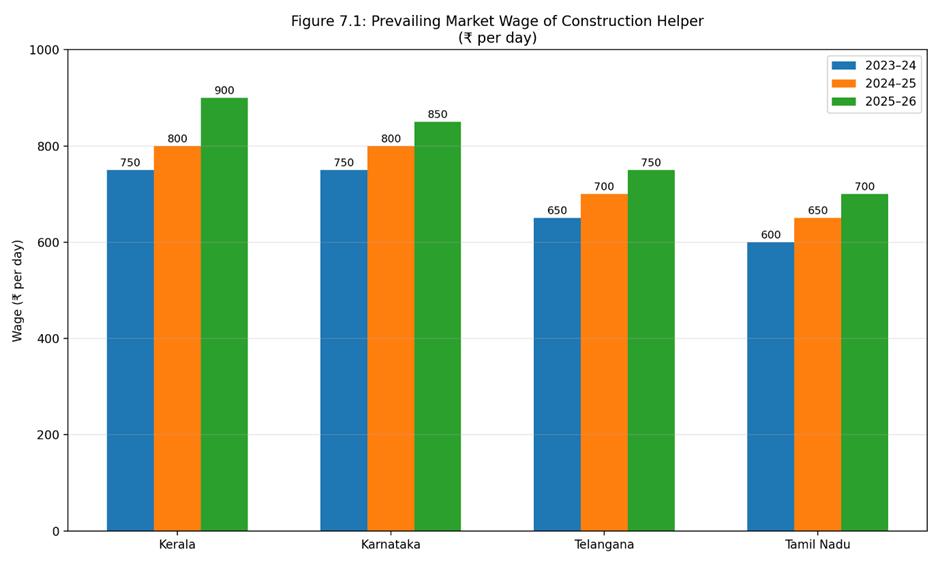
Figure 7.1
Table 7.1 presents the prevailing market wages for selected construction occupations in Kerala, Tamil Nadu, Karnataka and Telangana during the study period.
- Kerala records the highest prevailing market wages for construction helpers throughout the study period.
- Karnataka closely follows Kerala during 2023–24 and 2024–25 but remains slightly lower in 2025–26.
- Telangana maintains intermediate wage levels, while Tamil Nadu records the lowest market wages among the four states.
- All four states exhibit a steady increase in market wages over the three-year period, reflecting inflationary pressures and tightening labour markets.
- The use of market wages, rather than statutory minimum wages, provides a more realistic basis for evaluating workers’ purchasing power and affordability.
Key Takeaways
- Kerala continues to offer the highest market wages among the four states.
- The wage gap between Kerala and neighbouring states narrows slightly over time but remains substantial.
Since labour wages determine purchasing power, the next section examines whether Kerala’s comparatively higher wages offset its higher retail liquor prices.
7.2 Retail Liquor Prices
| Brand | Category | Reason |
| McDowell’s No.1 Whisky | Whisky | Widely available |
| Officer’s Choice Whisky | Whisky | Popular budget brand |
| Mansion House Brandy | Brandy | Very popular in South India |
| McDowell’s Celebration Rum | Rum | Represents the rum segment |
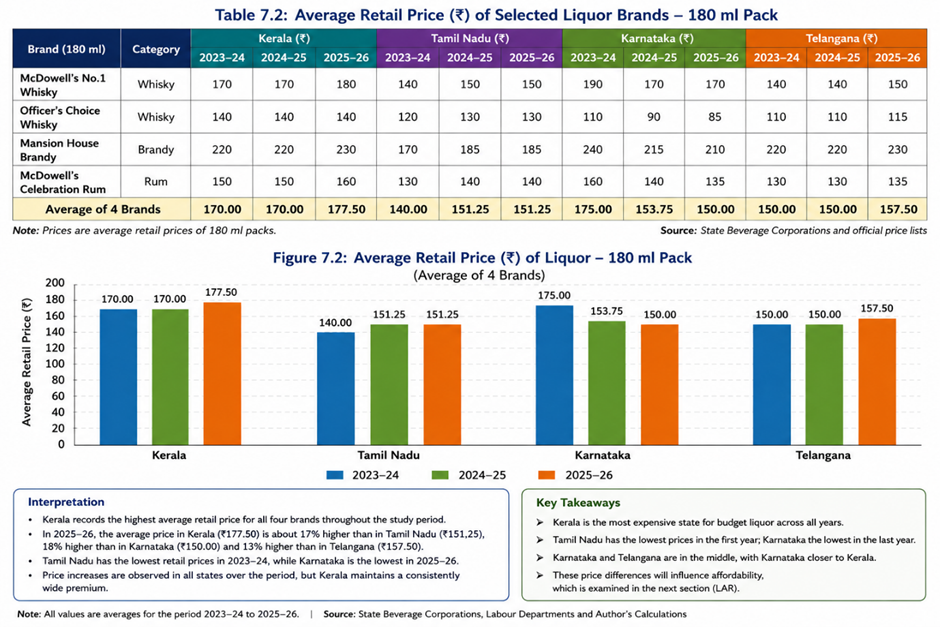
Although Kerala records the highest retail prices, price alone does not indicate affordability. A more meaningful comparison considers wages alongside prices, which is examined through the Liquor Affordability Ratio.
7.3 Liquor Affordability Ratio (LAR)
LAR=Average Retail Price of 180 ml Liquor/Daily Market Wage
The LAR figures based on the retail price of liquor in the four states.
| State | 2023–24 | 2024–25 | 2025–26 |
| Kerala | 0.227 | 0.213 | 0.197 |
| Tamil Nadu | 0.311 | 0.303 | 0.275 |
| Karnataka | 0.318 | 0.256 | 0.231 |
| Telangana | 0.231 | 0.214 | 0.210 |
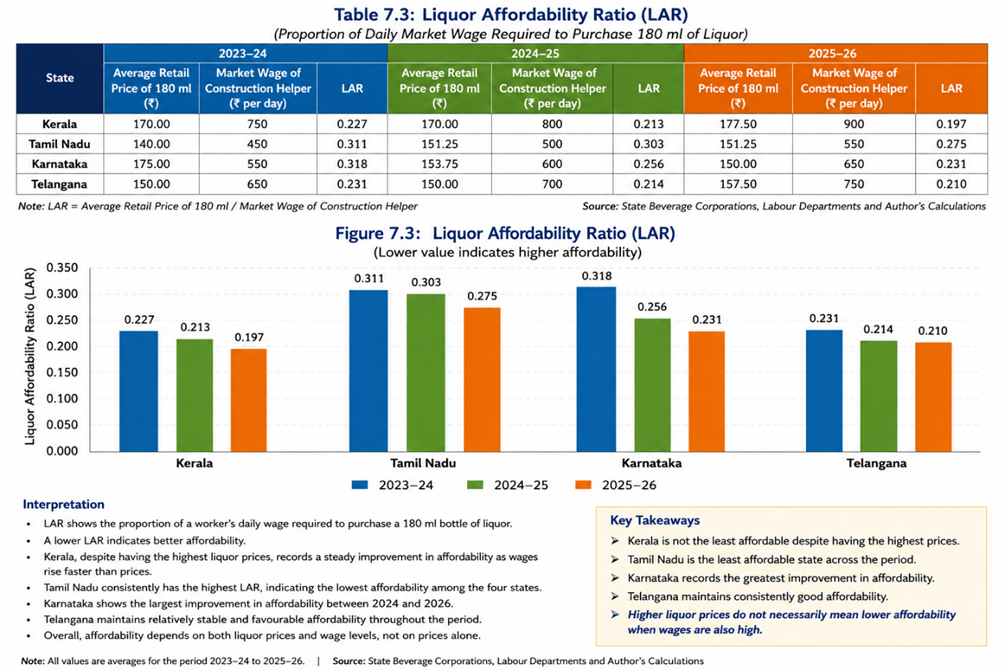
- LAR shows the proportion of a worker’s daily wage required to purchase a 180 ml bottle of liquor.
- A lower LAR indicates better affordability.
- Although Kerala has the highest retail liquor prices, its higher wages offset the impact, resulting in an LAR that is lower than Tamil Nadu in all three years.
- Overall, liquor affordability has improved slightly in all states from 2023–24 to 2025–26 due to faster wage growth relative to liquor price increases.
- The Liquor Affordability Ratio (LAR) demonstrates that affordability depends on the relationship between prices and wages rather than prices alone. Kerala, despite having the highest retail liquor prices, records a steady improvement in affordability over the study period as wages increase faster than liquor prices. Tamil Nadu consistently records the highest LAR, indicating the lowest affordability among the four states. Karnataka shows the greatest improvement in affordability between 2024 and 2026, while Telangana maintains relatively stable and favourable affordability throughout the study period.
Key Takeaways
- Kerala records the highest retail liquor prices, but higher wages substantially offset their impact.
- Tamil Nadu consistently exhibits the lowest liquor affordability, despite having significantly lower retail prices.
- Karnataka records the largest improvement in affordability over the study period.
- Telangana maintains consistently favourable affordability.
- Liquor affordability depends on both retail prices and labour wages—not on prices alone.
The analysis demonstrates that higher retail prices do not necessarily translate into lower affordability because wage levels vary substantially across states.
This is one of the principal findings.
7.4 Evening Leisure Cost Index
ELCI=Total Evening Leisure Cost/Daily Market Wage
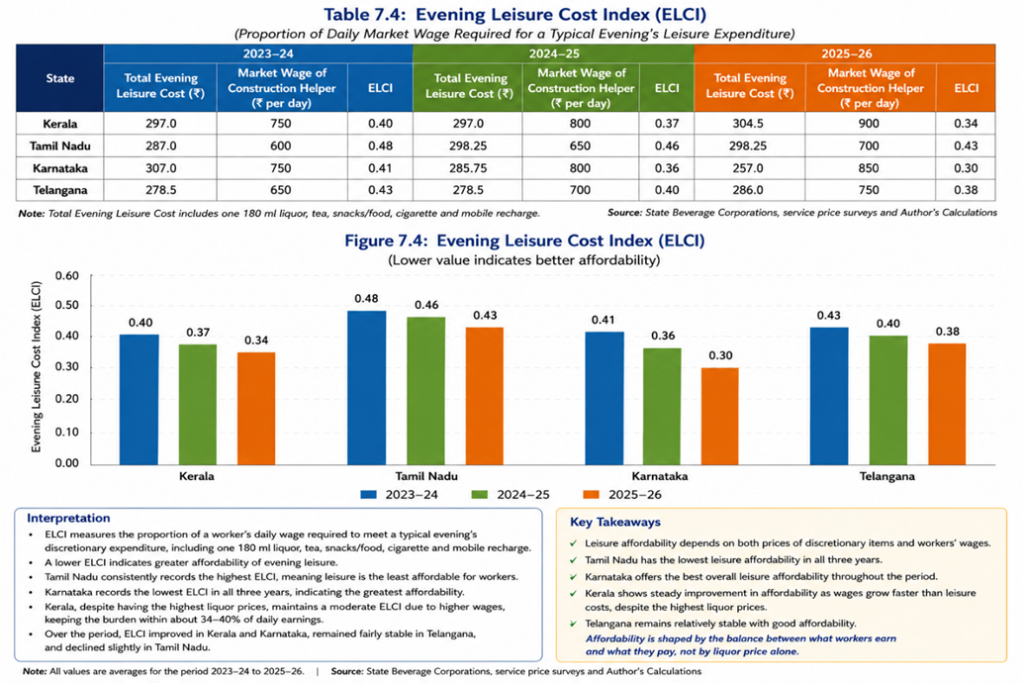
- ELCI measures the proportion of a worker’s daily wage required to meet a typical evening’s discretionary expenditure, including one 180 ml liquor, tea, snacks/food, cigarette and mobile recharge.
- A lower ELCI indicates greater affordability of evening leisure.
- Tamil Nadu consistently records the highest ELCI, meaning leisure is the least affordable for workers.
- Karnataka records the lowest ELCI in all three years, indicating the greatest affordability.
- Kerala, despite having the highest liquor prices, maintains a moderate ELCI due to higher wages, keeping the burden within about 54–57% of daily earnings.
- Over the period, ELCI improved slightly in Kerala and Karnataka, remained stable in Telangana, and declined only marginally in Tamil Nadu.
Key Takeaways
- Leisure affordability depends on both prices and wages.
- Higher wages in Kerala offset higher prices, keeping leisure affordability better than in Tamil Nadu.
- Karnataka offers the best overall leisure affordability.
- Policy aimed at reducing the cost of everyday discretionary items (food, transport, communication) can further improve affordability.
Affordability is shaped by the balance between what workers earn and what they pay, not by liquor price alone. These findings indicate that workers evaluate affordability in terms of total discretionary expenditure rather than liquor prices alone.
7.5 Urban Service Costs
| State / Hub | Base Electrician Visit Fee (INR) | Base Plumber Visit Fee (INR) | Painting Labor Only (per sq. ft. INR) | Standard Veg Meal (INR) | Mens Haircut Avg (INR) |
| Kerala (Kochi) | 199.5 | 224.5 | 14 | 110 | 150 |
| Tamil Nadu (Chennai) | 199.5 | 199.5 | 9 | 100 | 130 |
| Karnataka (Bengaluru) | 274.5 | 274.5 | 14 | 125 | 200 |
| Telangana (Hyderabad) | 224.5 | 224.5 | 11 | 115 | 160 |
Table 7.5
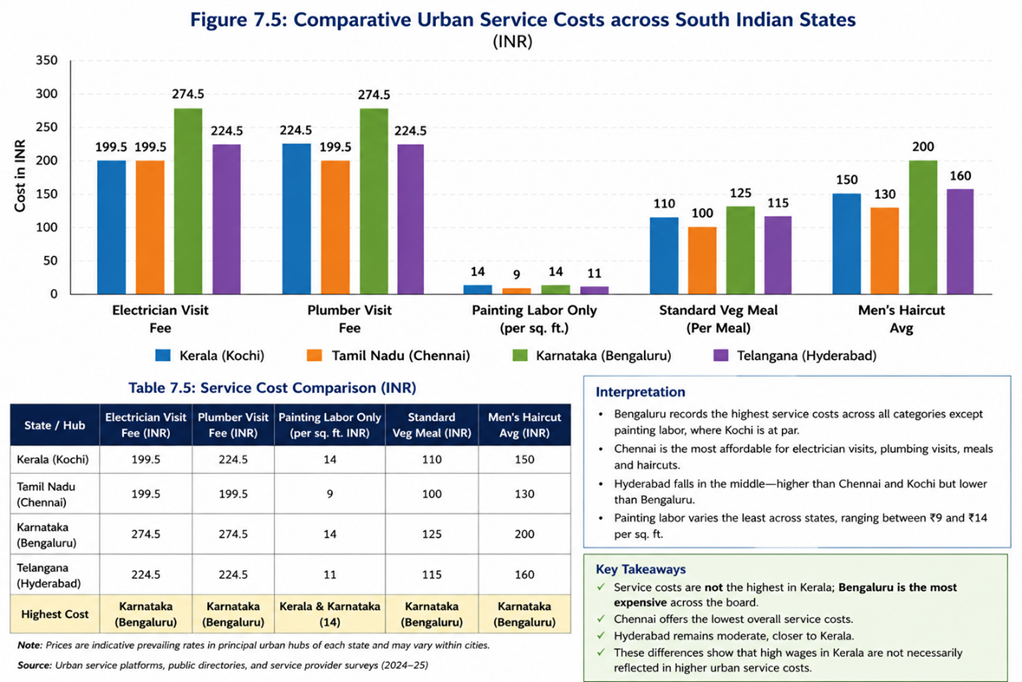
- Bengaluru records the highest service costs across all categories except painting labour, where Kochi is at par.
- Chennai is the most affordable for electrician visits, plumbing visits, meals and haircuts.
- Hyderabad falls in the middle—higher than Chennai and Kochi but lower than Bengaluru.
- Painting labour varies the least across states, ranging between ₹9 and ₹14 per sq. ft.
Key Takeaways
- ✓ Service costs are not the highest in Kerala; Bengaluru is the most expensive across the board.
- ✓ Chennai offers the lowest overall service costs.
- ✓ Hyderabad remains moderate, closer to Kerala.
- ✓ These differences show that high wages in Kerala are not necessarily reflected in higher urban service costs.
Higher wages alone do not automatically produce higher service costs; broader market conditions also play a significant role.
“The comparison suggests that higher labour wages alone do not fully explain differences in urban service costs; local market conditions, productivity, commercial rents and competition also appear to influence service pricing.”
The evidence suggests that higher wages do not automatically translate into uniformly higher urban service costs.
7.6 Alcohol Tax Burden
ATBI=Estimated Tax Component/Retail Price
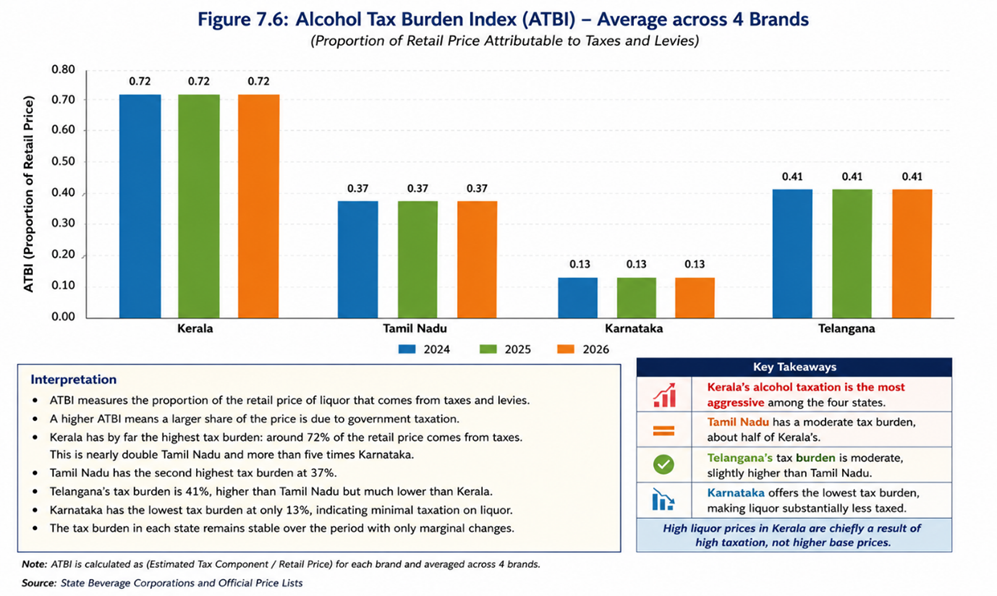
- ATBI measures the proportion of the retail price of liquor that comes from taxes and levies.
- A higher ATBI means a larger share of the price is due to government taxation.
- Kerala has by far the highest tax burden: around 72% of the retail price comes from taxes. This is nearly double Tamil Nadu and more than five times Karnataka.
- Tamil Nadu has the second highest tax burden at 37%.
- Telangana’s tax burden is 41%, higher than Tamil Nadu but much lower than Kerala.
- Karnataka has the lowest tax burden at only 13%, indicating minimal taxation on liquor.
- The tax burden in each state remains stable over the period with only marginal changes.
Key Takeaways
- Kerala’s alcohol taxation is the most aggressive among the four states.
- Tamil Nadu has a moderate tax burden, about half of Kerala’s.
- Telangana’s tax burden is moderate, slightly higher than Tamil Nadu.
- Karnataka offers the lowest tax burden, making liquor substantially less taxed.
7.7 Integrated Comparative Analysis
The preceding sections examined labour wages, retail liquor prices, liquor affordability, evening leisure affordability, urban service costs and alcohol taxation separately. When these findings are considered together, a clearer understanding emerges of the economic relationships operating within Kerala’s labour market.
The first question addressed by this study is why retail liquor prices are significantly higher in Kerala than in the neighbouring southern states. The Alcohol Tax Burden Index (ATBI) provides a clear explanation. Kerala consistently records the highest tax burden among the four study states, with approximately 72 per cent of the retail price of the selected liquor brands attributable to state taxation and statutory levies. By comparison, the corresponding proportions are about 41 per cent in Telangana, 37 per cent in Tamil Nadu and only 13 per cent in Karnataka. The evidence therefore strongly indicates that Kerala’s higher retail liquor prices are primarily the result of fiscal policy rather than higher manufacturing or distribution costs.
The second question is whether these higher prices make liquor significantly less affordable for workers. The Liquor Affordability Ratio (LAR) demonstrates that the answer is not straightforward. Although Kerala records the highest retail liquor prices, it does not exhibit the highest affordability burden. Construction workers in Kerala also earn substantially higher daily wages than their counterparts in the neighbouring states, and these higher wages largely offset the effect of higher liquor prices. As a result, Kerala’s LAR remains lower than that of Tamil Nadu and broadly comparable with those of Karnataka and Telangana. The analysis therefore shows that affordability cannot be assessed on the basis of price alone; purchasing power must also be considered.
The Evening Leisure Cost Index (ELCI) extends this analysis by considering a broader basket of discretionary expenditure typically associated with an evening’s leisure activities. The results again demonstrate that Kerala’s workers do not experience the highest affordability burden despite facing the highest liquor prices. While leisure expenditure is relatively expensive in absolute terms, higher wages preserve a level of affordability that compares favourably with neighbouring states. Karnataka records the most favourable affordability, while Tamil Nadu consistently records the highest burden.
The comparison of urban service costs introduces an additional perspective. If high alcohol taxation directly translated into higher wage demands and higher service prices, Kerala would be expected to exhibit the highest urban service costs across all categories. However, the available evidence does not support such a conclusion. Using representative prices from Kochi, Chennai, Bengaluru and Hyderabad, Bengaluru records the highest costs for most of the selected services, while Kochi’s prices are generally comparable with those of Hyderabad and only moderately higher than Chennai. Although these observations are based on metropolitan rather than statewide data, they suggest that higher labour wages alone do not automatically produce the highest urban service costs.
Taken together, these findings indicate that Kerala’s labour market is influenced by a broader set of structural factors than alcohol taxation alone. The literature reviewed earlier identifies foreign remittances, demographic transition, labour shortages, organised labour and interstate migration as important determinants of wage formation. The empirical evidence presented in this study is consistent with that interpretation. Alcohol taxation clearly explains the state’s higher retail liquor prices, but its influence on labour wages and service costs appears to operate within a much wider economic environment shaped by labour-market conditions and household income dynamics.
The findings therefore only partially support the original hypothesis. Kerala’s higher alcohol taxation is clearly associated with higher retail liquor prices, but the evidence does not establish that taxation alone is responsible for the state’s comparatively higher wages or urban service costs. Instead, the results suggest that Kerala has evolved a high-tax, high-wage equilibrium, in which higher labour incomes largely preserve leisure affordability despite substantially higher alcohol taxation. This equilibrium appears to be sustained by the combined influence of remittance-supported household incomes, labour shortages, demographic change, organised labour and continued interstate migration, rather than by alcohol taxation in isolation.
Accordingly, the relationship observed in this study may be summarised as follows:
Higher Alcohol Taxation → Higher Retail Liquor Prices → Potential Upward Pressure on Leisure- Costs →Higher Labour Wages → Maintained Liquor and Leisure Affordability → Urban Service Costs Influenced by Multiple Structural Factors
Rather than supporting a simple cause-and-effect relationship between alcohol taxation and wage inflation, the evidence points to a more complex economic system in which taxation, labour markets, affordability and demographic factors interact to shape Kerala’s distinctive economic characteristics.
8. Integrated Discussion
The comparative analysis demonstrates that no single dataset is sufficient to explain Kerala’s distinctive economic characteristics. Instead, the evidence suggests that labour wages, alcohol taxation, affordability and service costs are interconnected through a broader economic system in which fiscal policy interacts with labour-market dynamics and structural socioeconomic factors. The purpose of this chapter is to integrate the findings from the previous analyses and assess the extent to which they support the research hypothesis.
8.1 Why Are Retail Liquor Prices Highest in Kerala?
The Alcohol Tax Burden Index (ATBI) provides the clearest explanation for Kerala’s comparatively high retail liquor prices. Approximately 72 per cent of the retail price of the selected liquor brands is attributable to state taxation and statutory levies, compared with about 41 per cent in Telangana, 37 per cent in Tamil Nadu and only 13 per cent in Karnataka. The analysis therefore indicates that Kerala’s higher liquor prices are principally a consequence of fiscal policy rather than higher manufacturing, transportation or distribution costs.
This finding confirms the first proposition of the conceptual framework, namely that higher alcohol taxation directly increases retail liquor prices.
8.2 Does Higher Price Necessarily Mean Lower Affordability?
The Liquor Affordability Ratio (LAR) demonstrates that higher prices alone do not determine affordability. Although Kerala records the highest retail liquor prices, its comparatively higher labour wages substantially reduce the affordability burden. In fact, Kerala does not exhibit the highest LAR among the four study states. Tamil Nadu, despite having considerably lower liquor prices, records the least favourable affordability because wages are also significantly lower.
This finding highlights an important distinction between price and affordability. While price measures the amount paid by consumers, affordability reflects the relationship between expenditure and income. The results therefore suggest that purchasing power provides a more meaningful basis for comparison than retail prices alone.
8.3 Is Evening Leisure Beyond the Reach of the Average Worker?
The Evening Leisure Cost Index (ELCI) extends the affordability analysis beyond the purchase of liquor by incorporating other discretionary expenses commonly associated with an evening’s leisure activities. Once again, Kerala does not emerge as the least affordable state. Although workers in Kerala spend more in absolute terms on an evening’s leisure, higher wages compensate for these higher costs and maintain a moderate level of affordability. Karnataka records the most favourable affordability, while Tamil Nadu consistently records the highest affordability burden.
These findings suggest that workers evaluate their standard of living in terms of overall discretionary purchasing power rather than the price of alcohol in isolation. The ability to sustain leisure expenditure appears to depend on the balance between income and expenditure rather than on retail prices alone.
8.4 Do Higher Wages Automatically Produce Higher Service Costs?
One of the original motivations for this study was the commonly held belief that Kerala’s comparatively high wages inevitably result in higher service costs. The comparison of representative urban service prices provides a more nuanced picture.
Using metropolitan service costs from Kochi, Chennai, Bengaluru and Hyderabad, Bengaluru records the highest prices for most of the selected services. Kochi’s service costs are broadly comparable with Hyderabad and only moderately higher than Chennai. These findings suggest that higher wages alone do not necessarily translate into the highest service costs.
Service pricing appears to be influenced by a wider range of factors, including local demand, commercial rents, urban density, productivity, competition, business practices and labour availability. Consequently, labour wages represent only one component of the overall cost structure of labour-intensive services.
8.5 Revisiting the Original Hypothesis
The original hypothesis proposed that Kerala’s relatively high taxation on alcoholic beverages contributes to higher wage expectations and, consequently, higher service costs.
The evidence obtained from this study provides partial support for this proposition.
The relationship between alcohol taxation and retail liquor prices is both clear and substantial. Similarly, higher wages in Kerala appear to preserve affordability despite higher prices. However, the evidence does not establish that alcohol taxation alone is responsible for Kerala’s comparatively higher labour wages or urban service costs.
Accordingly, the null hypothesis is not fully supported, because a measurable association exists between alcohol taxation and retail liquor prices as well as affordability indicators. At the same time, the alternative hypothesis is only partially supported, as labour wages and service costs are found to be influenced by a broader set of structural factors—including remittances, demographic transition, labour shortages, organised labour and interstate migration—rather than alcohol taxation alone.
The evidence therefore suggests that alcohol taxation forms one important component of Kerala’s economic system, but it is not, by itself, sufficient to explain the state’s comparatively high labour wages or service costs.
8.6 Kerala’s High-Tax, High-Wage Equilibrium
Perhaps the most significant contribution of this study is the identification of what may be described as a high-tax, high-wage equilibrium.
In this equilibrium:
- High alcohol taxation increases retail liquor prices.
- Higher labour wages preserve liquor affordability.
- Evening leisure remains moderately affordable despite higher prices.
- Urban service costs are influenced by labour wages but are also shaped by broader structural and market conditions.
Rather than representing a simple cause-and-effect relationship, Kerala’s economy appears to operate through an interconnected system in which taxation, wages, affordability and labour-market institutions adjust simultaneously.
This interpretation is more consistent with the empirical evidence than the original assumption that higher alcohol taxation directly causes wage inflation.
9. Policy Implications
The findings of this study have implications for fiscal policy, labour market planning and the assessment of affordability. Although the analysis does not establish direct causal relationships, it provides several insights that may assist policymakers in evaluating the broader economic consequences of alcohol taxation.
9.1 Alcohol Taxation Should Be Evaluated in a Broader Economic Context
The study confirms that Kerala’s comparatively high retail liquor prices are primarily attributable to state taxation. However, higher prices do not necessarily translate into lower affordability because labour wages are also comparatively higher. This suggests that alcohol taxation should be evaluated not only as a source of government revenue and a public health instrument, but also in relation to its interaction with labour incomes and household purchasing power.
9.2 Affordability Is a More Meaningful Indicator Than Price Alone
The Liquor Affordability Ratio (LAR) and the Evening Leisure Cost Index (ELCI) demonstrate that retail prices by themselves provide only a partial understanding of economic burden. Policymakers comparing interstate taxation policies may therefore benefit from considering affordability indicators that relate expenditure to income rather than relying solely on absolute prices.
9.3 Labour Market Policies Must Recognise Structural Influences
The findings indicate that Kerala’s labour market is shaped by several interacting structural factors, including demographic transition, labour shortages, remittance-supported household incomes, organised labour and interstate migration. Consequently, wage formation should be viewed as the outcome of multiple economic forces rather than as a direct consequence of fiscal policy alone. Policies aimed at improving labour productivity, workforce participation and skill development are likely to have a greater long-term influence on wage sustainability than changes in alcohol taxation alone.
9.4 Service Cost Inflation Requires a Multi-Dimensional Policy Response
The comparison of representative urban service costs suggests that higher wages do not automatically translate into the highest service prices. Service inflation appears to reflect a combination of labour costs, commercial rents, market competition, urban operating expenses and local demand conditions. Measures to improve productivity, encourage technological adoption in labour-intensive sectors and enhance market efficiency may therefore be more effective in moderating service costs than focusing solely on wage levels.
9.5 Planning for Kerala’s Changing Labour Market
Kerala’s economy is increasingly characterised by an ageing population, sustained interstate migration of manual workers and continued dependence on remittance-supported household incomes. These structural changes are likely to influence labour availability and wage dynamics over the coming decades. Long-term labour market planning should therefore focus on workforce development, productivity enhancement and the effective integration of migrant labour while maintaining fair labour standards.
9.6 Evidence-Based Policy Evaluation
Finally, the study demonstrates the value of integrating affordability measures with conventional price and taxation data. Future policy evaluations relating to alcohol taxation or other consumption taxes may benefit from incorporating affordability-based indicators alongside traditional fiscal measures. Such an approach would provide a more comprehensive assessment of the economic burden experienced by households and improve the evidence base for public policy decisions.
This study suggests that public debate should move beyond comparing liquor prices alone. A more meaningful assessment of alcohol taxation should consider the combined effects of taxation, wages, purchasing power and labour-market conditions. Evaluating affordability rather than price provides a more balanced understanding of how fiscal policy affects workers’ everyday economic lives.
10. Limitations of the Study
Like all empirical studies, the present analysis is subject to certain limitations that should be considered while interpreting its findings.
10.1 Limited Geographic Coverage
The study is confined to four southern Indian states—Kerala, Tamil Nadu, Karnataka and Telangana. While these states provide a meaningful basis for comparison because of their broadly similar socioeconomic characteristics, the findings cannot be generalised to all Indian states, particularly those with different labour market structures, taxation policies or patterns of alcohol consumption.
10.2 Urban Representation of Service Costs
Comparable statewide databases on service costs are not available in India. Consequently, the analysis relies on representative prices from the principal metropolitan city of each state—Kochi, Chennai, Bengaluru and Hyderabad. While Kochi may reasonably reflect urban Kerala because of the state’s relatively compact geography and high level of urbanisation, the metropolitan prices used for the other states may not fully represent statewide averages. Accordingly, the service cost analysis should be interpreted as an urban comparison rather than a comprehensive interstate assessment.
10.3 Limited Product Coverage
The liquor price analysis is based on four widely available budget brands sold in 180 ml retail packs. These brands were selected because they were consistently available across all four states and are representative of products commonly consumed by working-class customers. The findings should therefore not be interpreted as representing the entire alcoholic beverage market or premium product segments.
10.4 Representative Occupational Group
Although wage data were compiled for several construction occupations, the affordability analysis is based primarily on the prevailing market wage of a construction helper. This occupation was selected because it represents the earnings of an entry-level manual worker, who forms the principal focus of the study. Affordability patterns may differ for workers in other occupations or income groups.
10.5 Time Period of Analysis
The study covers the three financial years from 2023–24 to 2025–26. While this period captures recent economic conditions and taxation policies, it is insufficient to examine long-term structural changes or cyclical variations in labour markets, alcohol taxation and consumer behaviour.
10.6 Data Availability
The analysis relies entirely on secondary data obtained from official notifications, government publications, state beverage corporations and publicly available service-price platforms. Although every effort was made to verify and standardise the data, differences in reporting practices and data availability across states may introduce minor inconsistencies that are beyond the control of the researcher.
10.7 Interpretation of Economic Relationships
The study employs a comparative descriptive approach and develops three analytical indicators—the Liquor Affordability Ratio (LAR), the Evening Leisure Cost Index (ELCI) and the Alcohol Tax Burden Index (ATBI)—to examine relationships between taxation, affordability and labour markets. While these indicators provide useful measures for interstate comparison, they identify economic associations rather than establish direct causal relationships.
10.8 Structural Complexity
Finally, labour wages and service costs are influenced by numerous interacting economic, demographic and institutional factors, including labour shortages, migration, remittances, productivity, urbanisation, real estate costs and collective bargaining. Although the study evaluates the role of alcohol taxation within this broader context, it does not seek to quantify the individual contribution of each structural factor. The findings should therefore be interpreted as evidence of a multifactor economic system rather than proof of a single causal mechanism.
11. Future Research
The present study provides an exploratory assessment of the relationship between alcohol taxation, labour wages, affordability and urban service costs in four southern Indian states. While the findings offer useful insights into Kerala’s distinctive economic environment, they also identify several areas where further research would enhance understanding of the underlying relationships.
Future studies may expand the geographical scope by including additional Indian states with varying taxation policies, labour market characteristics and patterns of alcohol consumption. A broader interstate dataset would allow more comprehensive comparisons and improve the generalisability of the findings.
The analysis could also be strengthened by extending the time horizon beyond the three financial years covered in this study. A longer time series would enable researchers to examine the long-term effects of changes in taxation, wage dynamics and affordability, while reducing the influence of short-term economic fluctuations.
Another promising area for future research is the use of household expenditure surveys and consumer behaviour data to better understand how alcohol expenditure fits within the overall consumption basket of different income groups. Such information would permit the development of more refined affordability indicators that account for variations in household size, income distribution and consumption preferences.
The present study relied on representative urban service costs because comparable statewide data were not available. Future research based on district-level or statewide service-cost databases would provide a more comprehensive assessment of the relationship between labour wages and service pricing, particularly in rural and semi-urban areas.
Finally, future work may conduct a deep study with econometric techniques such as panel data analysis, multivariate regression or structural equation modelling to estimate the relative contribution of alcohol taxation, remittances, labour shortages, demographic transition, migration and labour-market institutions to wage formation and service costs. Such approaches would help distinguish correlation from causation and provide a deeper understanding of the complex economic interactions identified in this study.
The Liquor Affordability Ratio (LAR), Evening Leisure Cost Index (ELCI) and Alcohol Tax Burden Index (ATBI) developed in this study provide a foundation for such future investigations. These indicators may be refined, expanded and applied to other regions and time periods, thereby contributing to a broader evidence base for evaluating the interaction between taxation, affordability, labour markets and household welfare.
12. Conclusion
This study set out to examine a widely held perception in Kerala—that the state’s comparatively high taxation on alcoholic beverages contributes to higher labour wages and, consequently, higher service costs. To investigate this proposition, a comparative analysis was undertaken using data on construction labour wages, retail liquor prices, urban service costs and alcohol taxation across Kerala, Tamil Nadu, Karnataka and Telangana for the period 2023–24 to 2025–26. In addition, three analytical indicators—the Liquor Affordability Ratio (LAR), the Evening Leisure Cost Index (ELCI) and the Alcohol Tax Burden Index (ATBI)—were developed to provide a more comprehensive assessment of affordability than could be obtained from retail prices alone.
The findings clearly establish that Kerala has the highest alcohol tax burden among the four study states, resulting in the highest retail liquor prices. However, the analysis also demonstrates that these higher prices do not translate into the greatest affordability burden for workers. Comparatively higher labour wages substantially offset the effect of higher liquor prices, allowing workers in Kerala to maintain levels of liquor and leisure affordability that are broadly comparable with those in neighbouring states.
The study further shows that the relationship between labour wages and service costs is more nuanced than is often assumed. Although Kerala records comparatively high wages, the available urban service-cost comparison does not indicate that it consistently exhibits the highest service prices among the selected metropolitan cities. This finding suggests that service costs are shaped by a combination of labour costs, productivity, market conditions, commercial rents and other structural influences rather than by wage levels alone.
More importantly, the integrated analysis indicates that alcohol taxation represents only one component of Kerala’s broader economic system. The literature and empirical evidence together suggest that foreign remittances, demographic transition, labour shortages, organised labour and interstate migration also play significant roles in shaping wage formation and labour market outcomes. Consequently, the evidence does not support the proposition that alcohol taxation alone explains Kerala’s comparatively high wages or service costs.
Instead, the study points towards the existence of a high-tax, high-wage equilibrium, in which higher alcohol taxation raises retail liquor prices while higher labour incomes largely preserve affordability. This equilibrium appears to have evolved through the interaction of fiscal policy with wider demographic, institutional and labour-market forces rather than through a single causal mechanism.
Finally, the study demonstrates the importance of evaluating taxation policies through the broader lens of affordability rather than price alone. Public debate often focuses on the absolute price of alcohol, yet the economic burden experienced by workers depends equally on their earning capacity and purchasing power. A meaningful assessment of taxation policy must therefore consider the interaction between prices, wages and affordability within the wider context of labour markets and household welfare.
In conclusion, Kerala’s experience illustrates that the economics of alcohol taxation cannot be understood in isolation. It reflects a complex interaction of fiscal policy, labour market dynamics and social change. Appreciating this complexity enables a more balanced and evidence-based understanding of the state’s distinctive economic model and provides a foundation for more informed public policy and future research.
References:
[8] https://journalspoliticalscience.com
[9] https://pmc.ncbi.nlm.nih.gov
[10] https://www.instagram.com
© 2026 christopher.co.in