
Abstract
This paper analyses the determinants of telecom sector performance in India over the period 2019–2025, focusing on both Telecom Gross Revenue and Telecom Gross Value Added (GVA). Using quarterly data from regulatory, government, and industry sources, the study applies time-series econometric techniques designed to address non-stationarity, multicollinearity, and small-sample constraints. In the absence of cointegration, the analysis focuses on short-run dynamics using first-difference logarithmic autoregressive distributed lag models.
The results indicate that telecom gross revenue in India is price-led in the short run, with prepaid Average Revenue Per User (ARPU) exerting a positive and statistically significant effect on revenue growth. In contrast, growth in average data usage per subscriber is associated with lower contemporaneous revenue growth, reflecting the decoupling of consumption and monetisation under India’s ultra-low tariff and unlimited data regime. Infrastructure expansion, investment flows, and early-stage 5G adoption do not explain short-run revenue fluctuations within the available sample.
For Telecom GVA, no statistically significant short-run relationships are identified between value-added growth and telecom usage, pricing, investment, or infrastructure variables. This finding reflects the slow-moving and structural nature of sectoral value creation, which is unlikely to respond contemporaneously to quarterly fluctuations.
Overall, the study highlights a clear distinction between short-run revenue realisation and long-run economic contribution in India’s telecom sector and underscores the importance of pricing strategies for short-run financial performance. The results have implications for tariff policy, investment assessment, and future research as longer post-5G time series become available.
Contents
| 1. Introduction 2. Literature Review 3. Data Description and Pre-processing 3.1 Data sources, coverage, and variable definitions 3.2 Data cleaning and alignment 3.3 Time-series plots of key variables 3.4 Usage–revenue relationship: scatter and smoothing plots 3.5 Correlation heatmap and multicollinearity 3.6 Regression diagnostics: fitted values and residuals 4. Model Selection Strategy 4.1 Initial candidate model and econometric constraints 4.2 Principal Components Analysis and variable reduction 4.3 Choice of short-run Δ-log ADL specification 5. Model Estimation and Results 5.1 Estimation framework 5.2 Baseline Δ-log ADL results 5.3 Parsimonious and alternative specifications 5.4 Lag structure and delayed effects 5.5 Extended Model: 5.6 Interpretation of results 5.7 Summary of empirical findings |
| 6. Hypothesis Evaluation 6.1 Statement of the hypothesis 6.2 Evaluation based on econometric evidence 6.3 Hypothesis outcome 6.4 Interpretation and scope of inference 6.5 Concluding assessment 7. Empirical Analysis of Telecom Gross Value Added (GVA) 7.1 Conceptual Motivation and Variable Characteristics 7.2 Time-Series Diagnostics and Model Selection 7.3 Estimation Results 7.4 Hypothesis Evaluation for Telecom GVA 7.5 Interpretation and Implications 8. Conclusion 8.1 Summary of findings: Gross Revenue 8.2 Contextual interpretation and caveats 8.3 Summary of findings: Telecom GVA 9. Key Findings Appendix Annexure |
| Disclaimer This research has been undertaken solely out of personal academic interest in the telecom sector and reflects the independent analysis and views of the author. It does not represent or endorse the opinions, policies, or positions of any institution, organization, or government body, including DoT. All data used in the study were sourced exclusively from publicly available datasets; no confidential or official government records were accessed or utilized. The findings, interpretations, and conclusions presented herein are intended strictly for academic purposes and should not be construed as policy advice or institutional commentary. While every effort has been made to ensure accuracy and integrity, the author accepts full responsibility for any errors or omissions that may remain. |
1. Introduction
The Indian telecom sector, a major contributor to the nation’s GDP, has transitioned from a subscriber-addition phase to a value-creation phase, largely driven by 4G, fibre, and the recent deployment of 5G starting in late 2022. India’s telecom sector has seen explosive growth, driven by mobile broadband, smartphone adoption, and now the rollout of 5G and IoT networks.
With tariff competition restraining ARPU growth, the sector increasingly relies on data consumption as its primary revenue engine. This study aims to quantify the short-run determinants of TRAI Gross Revenue through an econometric framework. The analysis evaluates whether key sectoral variables—including data usage, ARPU, mobile towers, and FDI inflows—meaningfully predict revenue changes in the short term.
Understanding the drivers of telecom revenue is crucial for policy-makers. Against this backdrop, a critical policy question emerges: Does recent technology adoption and investment translate into higher sector performance?
Research Questions: The following two hypotheses have been formed for testing:
(i) H1: Post-2022, increases in 5G penetration, data consumption, broadband/smartphone adoption, IoT deployment, network investment (mobile towers, BTS), FDI, and ARPU positively predict India’s telecom Gross revenue.
(ii) H2: Post-2022, increases in 5G penetration, data consumption, broadband/smartphone adoption, IoT deployment, network investment (mobile towers, BTS), FDI, and ARPU positively predict Telecom GVA growth.
To test this, a comprehensive quarterly timeseries dataset (2019–2025) has been assembled and apply time-series econometric techniques. Both the cases will be considered separately using the same master data.
The next section is a description of the data and methodology. Then the empirical findings are presented, discuss their implications, and conclude with policy recommendations and future research directions.
Here the broader perspective is to see how industry-specific factors influence the sector itself. The analysis is in the context of Government of India’s push for digitalization and 5G rollout.
2. Literature Review:
Existing literature suggests that telecom markets globally have transitioned from voice- to data-centric revenue structures. Studies across emerging economies indicate that data consumption is strongly associated with revenue growth, while ARPU remains constrained by competitive pricing. Non-stationary (time-series) data and structural shifts pose challenges for long-run modelling, often requiring short-run dynamic frameworks.
Literatures are available that shows that increase in mobile penetration raises per-capita GDP growth in developing countries. GSMA Intelligence (2022) and Deloitte (2022) forecast 5G’s macroeconomic contribution at 1.5–2.5% of GDP by 2030, driven by use cases in IoT, autonomous vehicles, and industrial digitization. However, little research applies these frameworks systematically to the Indian telecom sector.
The attempt is to fill this gap by empirically testing whether the latest technology and investment drivers—especially 5G uptake, mobile data volumes, broadband, smartphones, IoT, and telecom capex—positively influence India’s telecom gross revenue. From the available knowledge, it is found that no prior academic paper has modeled India’s telecom revenues with these new variables in an integrated time-series framework.
This paper intent to contributes to the literature by combining the latest Indian telecom data with econometric methods (such as ARDL bounds testing, OLS, etc.) and directly addressing collinearity and non-stationarity issues common in telecom series.
3. Data Description and Pre-processing
3.1 Data sources, coverage, and variable definitions
The analysis is based on a quarterly dataset (25 quarterly observations) covering the period 2019Q1 to 2025Q1, constructed from publicly available sources including the Telecom Regulatory Authority of India (TRAI), the Department of Telecommunications (DoT), the Ministry of Statistics and Programme Implementation (MoSPI), GSMA Intelligence, and industry reports.
The dependent variables are (i) TRAI Gross Revenue, measured in nominal rupees (₹ crore), and (ii) Telecom Gross Value Added (GVA), measured in nominal rupees (₹ crore) at current prices. Independent variables capture telecom usage, pricing, access, infrastructure, investment, and technology adoption.
The dataset combines demand-side indicators (average data usage, subscriber counts), supply-side infrastructure metrics (mobile towers), and financial/market variables (prepaid ARPU, FDI inflows) in order to capture usage-led, price-led and investment-led drivers of sector performance.
All variables are observed at quarterly frequency. Where source data were reported at monthly or annual frequency, values were converted to quarterly series using standard aggregation methods consistent with the economic interpretation of the variable.
Table A1 in the Appendix provides a complete description of all variables used in the study, including definitions, units of measurement, data sources, and frequency.
3.2 Data cleaning and alignment
Prior to estimation, all numeric variables were cleaned to ensure consistency across sources. Variables expressed in different units were standardised wherever appropriate to facilitate comparison and transformation.
The final estimation sample consists of 25 quarterly observations. Missing observations arise primarily from technology-related indicators (e.g., 5G subscriptions, IoT/M2M connections) that become available only in later periods.
Stationarity diagnostics indicate that TRAI Gross Revenue is non-stationary. This pattern weakens the plausibility of a stable long-run equilibrium between revenue and the set of telecom indicators. The tests, namely, ARDL (Autoregressive Distributed Lag) bounds testing and ECM (Error Correction Model) failed to deliver robust evidence of cointegration for the multi-variables with the dependent variable.
Given these facts, the analysis focuses on short-run dynamics using a short-run Δ-log ADL (Delta Log Autoregressive Distributed Lag) specification. The short-run ADL model explains a large proportion of short-term variation and delivers economically sensible coefficients.
3.3 Time-series plots of key variables
Figure 1 presents quarterly time-series plots of TRAI Gross Revenue, prepaid ARPU, and average data usage per subscriber over the period 2019–2025. These plots reveal strong upward trends in levels for revenue and usage, alongside more moderate variation in ARPU.
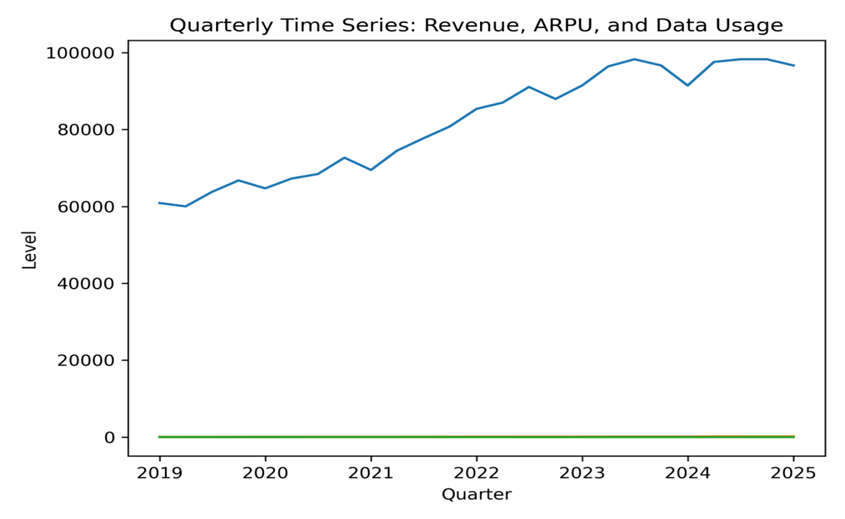
Fig 1. Quarterly time-series plots of TRAI Gross Revenue, prepaid ARPU, and average data usage per subscriber (2019–2025). The figure illustrates strong common trends in levels, motivating differencing and short-run modelling.
3.4 Usage–revenue relationship: scatter and smoothing plots
To provide an intuitive depiction of the relationship between consumption and revenue, Figure 2, plots log-changes in telecom gross revenue against log-changes in average data usage per subscriber.
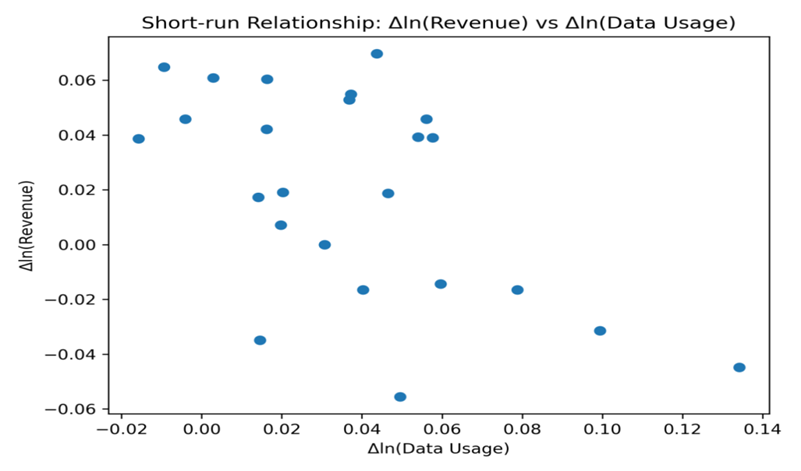
Fig 2: Scatter plot of quarterly log-changes in telecom gross revenue against log-changes in average data usage per subscriber. The downward slope highlights the negative short-run association between usage growth and revenue growth.
The figure shows a clear negative slope in the short-run relationship, indicating that quarters with higher growth in per-subscriber data usage tend to coincide with lower revenue growth. This visual evidence corroborates the regression-based finding of negative short-run usage elasticity and demonstrates that the result is not driven by a small number of outliers.
3.5 Correlation heatmap and multicollinearity
A key, recurring empirical challenge is structural multicollinearity across telecom indicators. Indicative measures such as average data usage, subscriber numbers and network capacity co-move strongly as the sector scales up. Many of the predictors themselves are highly correlated with each other. For example, variables capturing total mobile subscribers, total wireless subscribers, and total internet or broadband subscribers tend to move closely together over time. This is natural in a growing market where multiple subscriber classes expand in parallel. Investment and adoption indicators (such as BTS counts, mobile towers, and possibly 5G-related metrics) also display strong co-movement with each other and with subscriber numbers.
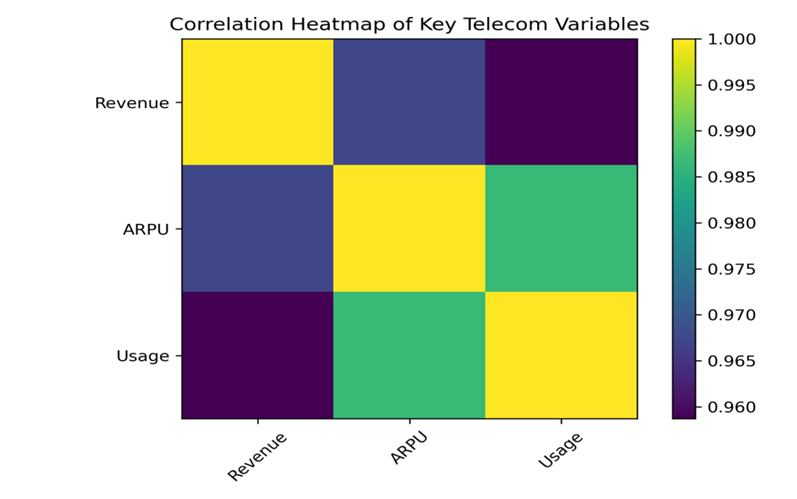
Fig 3: Correlation heatmap of key telecom indicators. Strong pairwise correlations justify variable reduction and the use of PCA in model selection.
Figure 3 presents a correlation heatmap of the full set of telecom indicators, including usage, pricing, subscriber counts, infrastructure variables, and investment measures. The heatmap reveals strong pairwise correlations among many variables—particularly between data usage, broadband subscribers, wireless subscribers, and infrastructure indicators—confirming the presence of structural multicollinearity.
This visual evidence supports the formal principal component analysis (PCA) results and justifies the exclusion of highly collinear variables from the final regression model in favour of a parsimonious specification that retains economic interpretability.
This pattern can be confirmed by high Variance Inflation Factors (VIFs). This suggests the predictors largely reflect a common underlying sector expansion factor rather than independent causal channels. As a result, classical OLS in levels yields high R² but unstable coefficients and potential multicollinearity bias; Δ-log ADL models therefore play an essential role in yielding stable, interpretable findings.
3.6 Regression diagnostics: fitted values and residuals
To assess the adequacy of the final Δ-log ADL specification, Figure 4 plots regression residuals against fitted values, along with a time-series plot of residuals. The residual–fitted plot shows no systematic pattern, suggesting that the linear functional form is appropriate. The residual time-series exhibits no obvious persistence, consistent with the absence of strong autocorrelation (once differencing and lagged dynamics are accounted for).
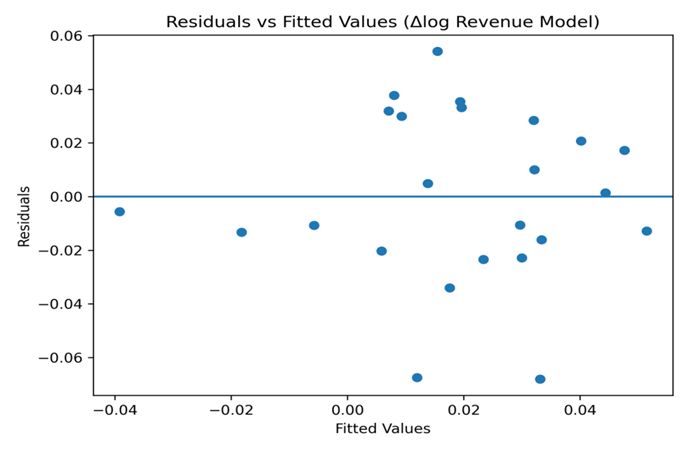
Fig 4: Residuals versus fitted values from the Δ-log ADL revenue model. The absence of systematic patterns suggests an adequate linear specification.
These diagnostic plots provide visual confirmation that the key regression assumptions are not grossly violated and that the estimated short-run elasticities are not driven by model misspecification.
4. Model Selection Strategy
The selection of an appropriate econometric specification was guided by three binding constraints inherent in the dataset and research question: (i) the short quarterly sample (2019–2025), (ii) the non-stationary nature of several telecom indicators, and (iii) strong multicollinearity among candidate explanatory variables capturing sector scale, usage, infrastructure, and investment.
4.1 Initial candidate model and econometric constraints
The initial modelling approach considered a broad set of telecom indicators reflecting demand-side usage (average data usage per subscriber), pricing (prepaid ARPU), access and scale (wireless and broadband subscribers), infrastructure (mobile towers, BTS), and investment (FDI inflows), consistent with the conceptual hypothesis that technology adoption and investment should influence sector performance.
However, preliminary diagnostics revealed that many of these indicators exhibit strong common trends and co-movement over time. This is not surprising in a rapidly expanding telecom market, where subscriber growth, network expansion, usage intensity, and pricing adjustments evolve jointly rather than independently. As a result, baseline OLS regressions in levels produces high R² values but unstable coefficients, large standard errors, and sensitivity to variable inclusion, symptoms of multicollinearity and potential spurious regression in time-series data. The baseline regression result may be seen below.
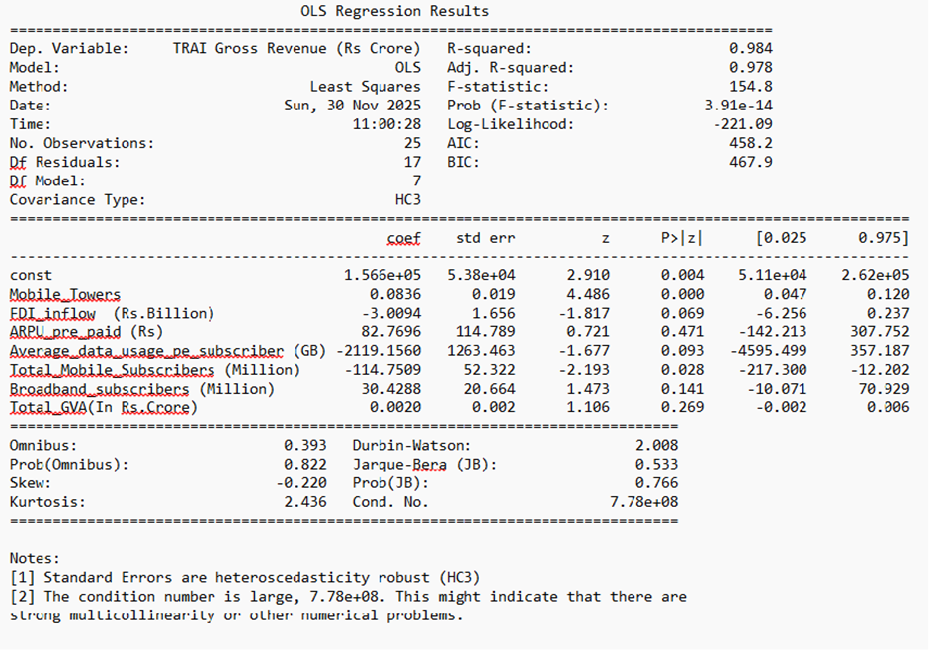
Fig 5: Baseline OLS (Gross Revenue)
At the same time, unit-root tests indicated that key variables, including TRAI Gross Revenue, are non-stationary in levels. ARDL bounds testing and related cointegration checks failed to provide robust evidence of a stable long-run equilibrium relationship among revenue and the broader set of telecom indicators. In the absence of cointegration, coefficients from level regressions cannot be interpreted as long-run structural effects and are therefore retained only as descriptive benchmarks illustrating persistence and co-movement, not causal relationships.
These constraints ruled out the use of large multivariate levels models and motivate to focus on short-run, stationary specifications.
4.2 Principal Components Analysis and variable reduction
To formally address multicollinearity and justify variable reduction, a Principal Components Analysis (PCA) was conducted on a comprehensive set of telecom indicators, including average data usage, prepaid ARPU, wireless subscribers, broadband subscribers, mobile towers, and FDI inflows. All variables were standardised prior to analysis.
The PCA results reveal a dominant first principal component (PC1) that explains approximately two-thirds of the total variation across the telecom indicators. This component loads strongly and positively on average data usage, prepaid ARPU, broadband subscribers, and mobile towers, indicating the presence of a single latent “telecom expansion” factor capturing simultaneous growth in consumption intensity, pricing, access, and infrastructure. Investment (FDI) and subscriber scale contribute primarily to secondary components with substantially lower explanatory power.
This finding confirms that many commonly used telecom indicators reflect the same underlying structural trend and therefore do not represent independent explanatory channels. Including them jointly in regression models would inflate variance, obscure inference, and undermine interpretability.
Rather than employing all principal components directly in regression—which would complicate economic interpretation—the analysis projects this latent factor onto two economically distinct and policy-relevant observable variables: prepaid ARPU and average data usage per subscriber. ARPU captures the price and monetisation channel, while data usage captures consumption intensity. Together, these variables represent the dominant structural factor identified by PCA while preserving transparency and interpretability.
4.3 Choice of short-run Δ-log ADL specification
Given the absence of cointegration and the non-stationary nature of the level series, econometric inference focuses on short-run dynamics using first-difference logarithmic specifications. The preferred model is a Δ-log autoregressive distributed lag (ADL) specification, where the dependent variable is the quarterly growth rate of TRAI Gross Revenue, and explanatory variables include contemporaneous growth in prepaid ARPU and average data usage, along with a lagged dependent variable to capture short-run revenue dynamics.
This specification offers several advantages. First, differencing (lagged) removes common trends and mitigates the risk of spurious regression. Second, the parsimonious structure preserves degrees of freedom in a small sample. Third, the inclusion of economically interpretable regressors allows direct assessment of whether revenue dynamics in India’s telecom sector are driven by pricing or by consumption volumes in the short run.
Variance Inflation Factors (VIFs) in the final specification are close to unity, confirming that multicollinearity is no longer a concern once the model is restricted to the key observable manifestations of the dominant telecom expansion factor.
In summary, the final model is not the result of ad hoc variable selection but emerges from a systematic process combining theoretical relevance, time-series diagnostics, and formal dimensionality reduction. The chosen Δ-log ADL specification represents the most statistically defensible and economically interpretable framework for evaluating short-run revenue dynamics in India’s telecom sector over the available sample period.
5. Model Estimation and Results
5.1 Estimation framework
Following the model selection strategy outlined above, econometric estimation focuses on short-run dynamics using a first-difference logarithmic autoregressive distributed lag (Δ-log ADL) framework.
The dependent variable is the quarterly growth rate of TRAI Gross Revenue. Explanatory variables include contemporaneous quarterly growth in prepaid ARPU and average data usage per subscriber, along with a one-period lag of the dependent variable to capture short-run revenue dynamics and inertia. All variables are expressed in logarithmic differences, allowing coefficients to be interpreted as short-run elasticities.
The baseline specification is given by:

, where εt is an error term assumed to be serially uncorrelated.
5.2 Baseline Δ-log ADL results
Estimation results (see Fig 6) from the baseline Δ-log ADL model reveal two key patterns.
First, the growth rate of prepaid ARPU enters the model with a positive and statistically significant coefficient. The estimated elasticity indicates that an increase in ARPU is associated with a contemporaneous increase in telecom gross revenue in the same quarter. This result is robust across alternative specifications and aligns with the economic intuition that pricing adjustments translate directly into short-run revenue changes.
Second, average data usage per subscriber enters with a negative and statistically significant coefficient. Holding ARPU constant, higher growth in per-subscriber data consumption is associated with lower growth in telecom gross revenue within the same quarter. This finding is contrary to the conventional assumption that increased data consumption necessarily raises revenue, but it is consistent with India’s prevailing market structure, characterised by unlimited data plans, aggressive promotional pricing, and declining marginal revenue per gigabyte.
The coefficient on the lagged dependent variable is small and statistically insignificant, suggesting limited short-run persistence in revenue growth once contemporaneous pricing and usage effects are accounted for.
Overall, the baseline model explains a substantial share of quarter-to-quarter variation in revenue growth while maintaining a parsimonious structure suitable for the available sample size.
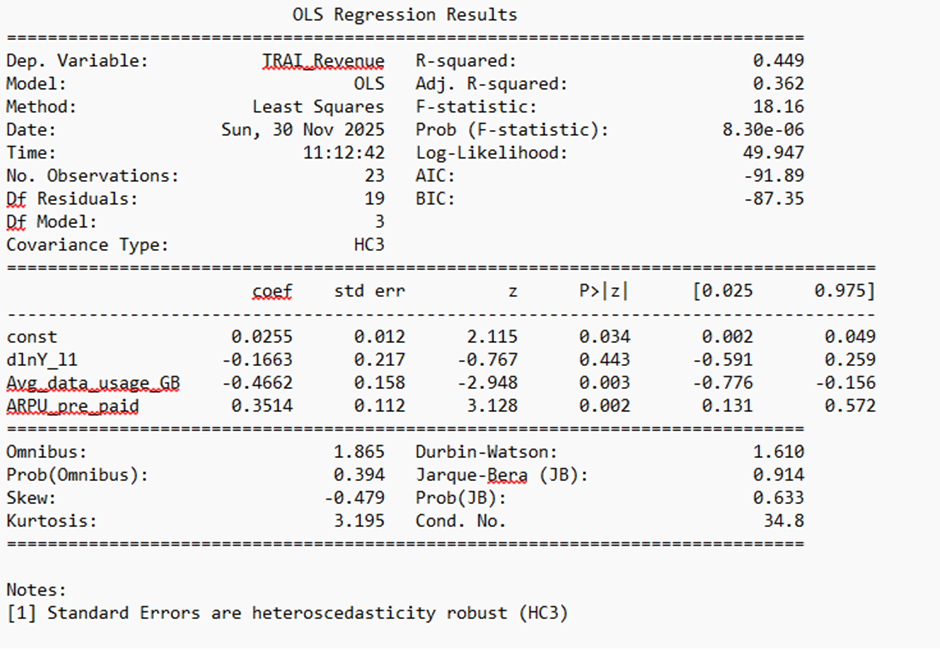
Fig 6: baseline Δ-log ADL revenue model
5.3 Parsimonious and alternative specifications
To assess the robustness of the baseline findings, several simplified and alternative specifications were estimated.
A usage-only Δ-log regression, excluding ARPU and the lagged dependent variable, yields a negative and statistically significant coefficient on data usage growth. The persistence of this result in a univariate setting confirms that the negative usage elasticity is not an artefact of conditioning on ARPU or of multicollinearity.
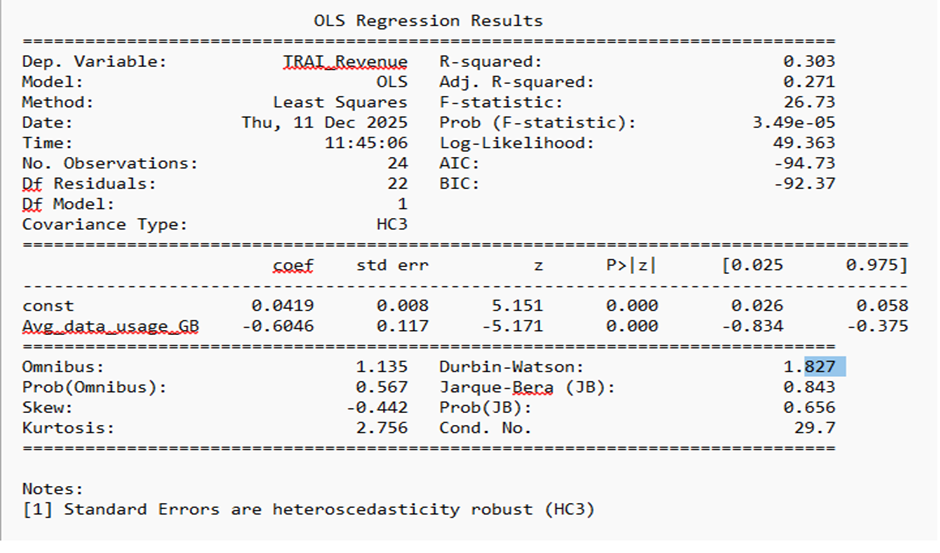
Fig 7: Usage-only revenue model
Similarly, an ARPU-only Δ-log regression produces a positive coefficient, though with weaker statistical significance in the absence of additional controls. This suggests that while ARPU is a meaningful revenue driver, its effect is more precisely estimated when usage dynamics are explicitly accounted for.
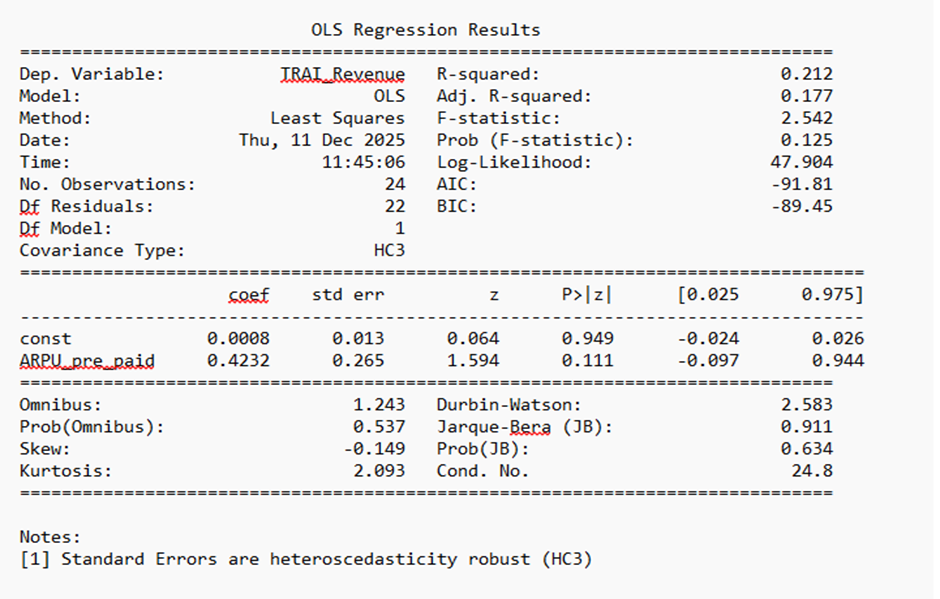
Fig 8: ARPU-only revenue model
Variance Inflation Factors (VIFs) for the baseline model are close to unity, confirming that multicollinearity does not distort coefficient estimates in the final specification. This outcome is consistent with the earlier PCA results, which showed that ARPU and data usage jointly capture the dominant latent telecom expansion factor while remaining sufficiently distinct to allow separate identification.
Computed VIFs:
| Variable | VIF |
| Avg_data_usage_GB | 1.28 |
| ARPU_pre_paid | 1.28 |
5.4 Lag structure and delayed effects
To explore the possibility that data usage influences revenue with a delay rather than contemporaneously, alternative ADL specifications incorporating lagged usage terms were estimated. These models show that while the contemporaneous usage coefficient remains negative and statistically significant, the lagged usage term enters with a positive but statistically weak coefficient.
This pattern suggests the possibility of delayed monetisation effects—such as gradual upgrades to higher-value plans or increased uptake of value-added services—but the evidence is insufficient to establish a robust lagged relationship within the current sample. The dominant short-run effect of usage growth remains negative.
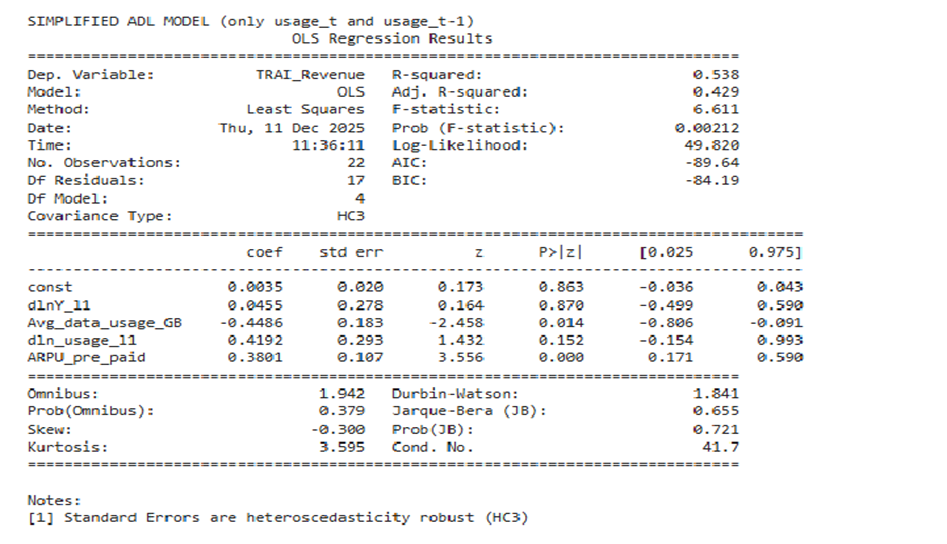
Fig 9: Data usage and Lagged Data Revenue model
5.5 Extended Model:
To validate the robustness of the short-run revenue model and better capture volume effects, an extended specification that includes subscriber base expansion was estimated. Specifically, we added the log of total mobile subscribers (Δln Subscribers) to the baseline ADL model already containing Δln ARPU and Δln Usage. The results are summarized in Table below.
| Variable | Coefficient | Std. Error | t-Statistic | p-Value |
| const | 0.005925 | 0.014819 | 0.399798 | 0.689305 |
| d_ln_arpu | 0.385061 | 0.101583 | 3.79061 | 0.00015 |
| d_ln_usage | -0.46241 | 0.146736 | -3.15128 | 0.001626 |
| d_ln_usage_lag | 0.406528 | 0.231499 | 1.756068 | 0.079077 |
| d_ln_subs | 0.08857 | 0.941854 | 0.094038 | 0.925079 |
However, the coefficient on ‘Δ ln Subscribers’ is positive but statistically insignificant (p = 0.925), suggesting that short-run revenue fluctuations are not driven by changes in user base, which may evolve more gradually. These results underscore that, in the short run, revenue is primarily shaped by pricing dynamics rather than subscriber expansion.
5.6 Interpretation of results
Taken together, the estimation results provide a consistent and economically coherent picture of short-run revenue dynamics in India’s telecom sector during the study period.
Revenue growth is driven primarily by pricing, as captured by changes in ARPU, rather than by increases in consumption volumes. Higher data usage per subscriber does not translate into higher revenue in the same quarter and is instead associated with lower revenue growth, reflecting the decoupling of usage from monetisation under ultra-low tariff regimes and unlimited data plans.
These findings do not imply that data consumption lacks long-term economic value. Rather, they indicate that, in the short run, consumption growth alone is insufficient to raise operator revenues in the absence of effective pricing or monetisation mechanisms.
5.7 Summary of empirical findings
The key empirical results from the model estimation can be summarised as follows:
- Prepaid ARPU is a positive and statistically significant short-run driver of telecom gross revenue.
- Average data usage per subscriber exhibits a robust negative short-run association with revenue growth.
- The negative usage effect persists across parsimonious and alternative specifications and is not driven by multicollinearity.
- There is limited evidence of short-run revenue persistence or delayed monetisation effects within the available quarterly sample.
These results form the empirical basis for the subsequent hypothesis evaluation and policy discussion.
6. Hypothesis Evaluation
6.1 Statement of the hypothesis
The primary research hypothesis (H1) proposed that, in the post-2022 period, increases in telecom technology adoption, usage, investment, and pricing—specifically 5G penetration, data consumption, broadband and smartphone adoption, infrastructure expansion, FDI inflows, and ARPU—would positively predict India’s telecom gross revenue.
This hypothesis reflects the conventional expectation that greater digital adoption and network expansion should translate into higher sectoral revenues, particularly in a data-centric telecom environment.
6.2 Evaluation based on econometric evidence
The econometric analysis provides partial and differentiated support for this hypothesis.
First, the pricing channel, as captured by prepaid ARPU, receives clear empirical support. Across the baseline Δ-log ADL specification and supporting robustness checks, growth in ARPU is positively and statistically significantly associated with contemporaneous growth in telecom gross revenue. This finding confirms that pricing adjustments and monetisation strategies directly influence short-run revenue realisation.
Second, the usage channel, represented by average data usage per subscriber, does not support the hypothesis. Contrary to the expected positive relationship, data usage growth exhibits a statistically significant negative short-run association with revenue growth across all estimated specifications, including parsimonious univariate models. This result indicates that increased consumption intensity does not raise operator revenues in the same quarter under prevailing tariff and bundling structures.
Third, infrastructure, investment, and adoption indicators—including mobile towers, BTS, broadband and wireless subscribers, FDI inflows, and 5G-related variables—do not display statistically robust short-run effects on revenue within the available sample. These variables either exhibit limited quarterly variation or influence revenue only indirectly and with longer lags, which cannot be reliably identified in the current dataset.
6.3 Hypothesis outcome
Taken together, the evidence does not support the hypothesis in its original broad form. Instead, the results indicate that the hypothesis must be qualified:
- Supported component: ARPU positively predicts short-run telecom revenue.
- Not supported: Data usage does not positively predict revenue; it is associated with lower short-run revenue growth.
- Not supported (short run): Infrastructure expansion, investment flows, and early 5G adoption do not explain quarterly revenue fluctuations within the sample period.
Accordingly, the null hypothesis cannot be rejected for usage-led, investment-led, or infrastructure-led short-run revenue effects. The hypothesis receives support only with respect to the pricing channel.
6.4 Interpretation and scope of inference
The partial rejection of the hypothesis does not imply that data consumption, infrastructure, or next-generation technologies lack economic relevance. Rather, it reflects the specific institutional and market context of India’s telecom sector during the study period.
In an environment characterised by ultra-low tariffs, unlimited data plans, and intense competition, increases in consumption volumes are decoupled from marginal revenue generation. Short-run revenue dynamics are therefore driven primarily by pricing decisions rather than by usage growth or network expansion.
Moreover, many of the variables hypothesised to affect revenue—such as infrastructure investment and 5G deployment—are likely to influence sector performance through longer-term productivity gains, quality improvements, and ecosystem development, which are not captured by short-run quarterly models.
6.5 Concluding assessment
In summary, the empirical evidence indicates that India’s telecom revenue dynamics during 2019–2025 are price-led rather than usage-led in the short run. The original hypothesis is therefore only partially supported and must be reformulated to distinguish between pricing effects that materialise immediately and structural factors whose economic impact unfolds over longer horizons.
This refined evaluation provides a more accurate and policy-relevant understanding of how telecom sector growth translates into revenue under India’s prevailing market conditions.
7. Empirical Analysis of Telecom Gross Value Added (GVA)
While the preceding analysis focuses on short-run determinants of telecom gross revenue, revenue represents only one dimension of sector performance. Revenue captures firm-level billing outcomes that respond directly to pricing strategies and consumption patterns. However, it does not fully reflect the telecom sector’s broader economic contribution, which materialises through capital formation, productivity improvements, and spill-over effects.
To account for this distinction, the analysis now turns to Telecom Gross Value Added (GVA). Unlike revenue, Telecom GVA measures the sector’s contribution to national income. Given these conceptual and dynamic differences, Telecom GVA is analysed separately using an econometric framework tailored to its macroeconomic characteristics.
7.1 Conceptual Motivation and Variable Characteristics
Telecom Gross Value Added (GVA) captures the sector’s contribution to national income (GDP) and reflects value creation through capital accumulation, productivity gains, technological upgrading, and regulatory conditions. Unlike gross revenue, which responds immediately to pricing and billing decisions, Telecom GVA is inherently a slow-moving macroeconomic aggregate, influenced by structural factors that evolve over longer horizons.
Given this conceptual distinction, Telecom GVA is analysed separately from revenue to avoid conflating short-run revenue realisation with sectoral value creation. The dependent variable is Telecom GVA measured at current prices in rupees crore. Explanatory variables mirror those used in the revenue analysis and include indicators of investment (FDI inflows, mobile towers, BTS), access and scale (broadband and wireless subscribers), usage (average data usage, ARPU, minutes of usage), and technology adoption (5G subscriptions, IoT/M2M connections).
7.2 Time-Series Diagnostics and Model Selection
Formal unit-root tests indicate that Telecom GVA is non-stationary in levels and becomes stationary after first differencing. Several explanatory variables exhibit similar properties. ARDL bounds testing and complementary cointegration checks fail to provide evidence of a stable long-run equilibrium relationship between Telecom GVA and the set of telecom indicators considered.
The baseline OLS model treats Telecom GVA as a function of its own one-quarter lag and a small set of contemporaneous predictors representing investment, access, and usage. The lagged dependent variable (L1_Telecom_GVA) is the only statistically significant predictor, with a coefficient close to 0.95 (p < 0.01), highlighting the strong persistence and structural inertia characteristic of sectoral gross value added. Other predictors—including FDI inflow, mobile tower count, ARPU, broadband subscribers, and average data usage per subscriber—are statistically insignificant in the short run, suggesting that GVA evolution is relatively
insensitive to quarter-on-quarter fluctuations in operational metrics.
Unit root tests indicate that Telecom GVA and most explanatory variables are non-stationary (I(1)). ARDL bounds testing and system-level cointegration analysis fails to detect a stable long-run equilibrium relationship.
Multicollinearity and non-normal residuals limit the interpretability of individual coefficients. The findings affirm that short-run predictors may be insufficient to capture the trajectory of telecom value added, warranting longer time horizons for robust inference.
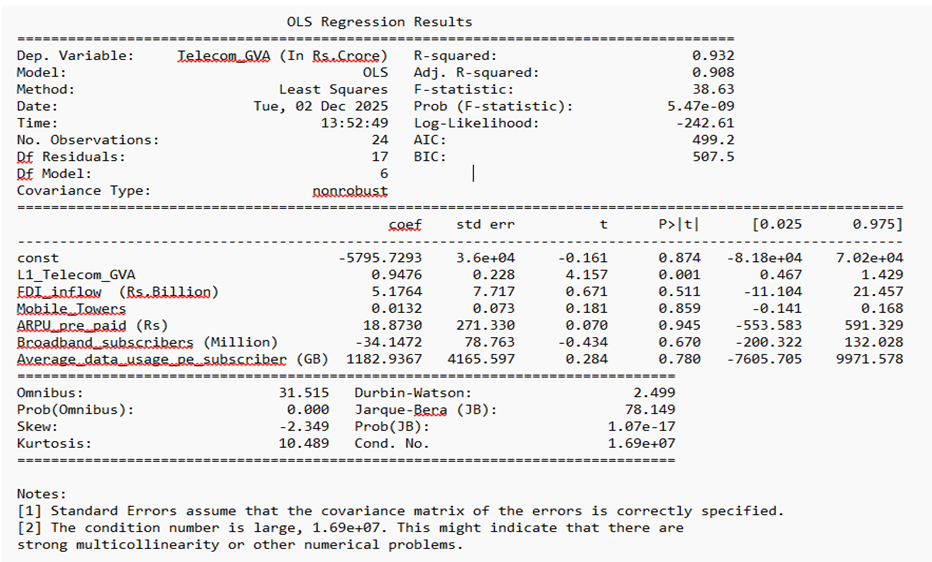
Fig 10: long-run levels GVA model
Model selection is further constrained by the short quarterly sample and by strong multicollinearity among many telecom indicators. Variables capturing subscriber scale, infrastructure expansion, and technology adoption exhibit substantial co-movement, reflecting a common underlying expansion of the sector rather than independent explanatory channels.
In the absence of cointegration, level-based regressions cannot be interpreted as long-run causal relationships and are therefore retained only as descriptive benchmarks illustrating co-movement and persistence. Econometric inference is restricted to short-run specifications using stationary first-difference logarithmic transformations.
7.3 Estimation Results
The revised GVA growth regression explicitly uses a Δ-log specification with a parsimonious set of predictors. In practice the model regresses the change in log GVA (Δln GVA) on the contemporaneous changes in log FDI, log tower count, log broadband penetration, log usage, and log ARPU. These five variables were chosen to capture distinct channels of economic activity: FDI as a capital input (widely documented as driving GDP growth), mobile‐network infrastructure (towers and broadband) and service demand (usage), and telecom revenue intensity (ARPU). The model was limited to these predictors to avoid multicollinearity and overfitting given the short time series. Using differences in log form means each coefficient is an elasticity (i.e. ∆ln Y ≈ percentage change in Y)
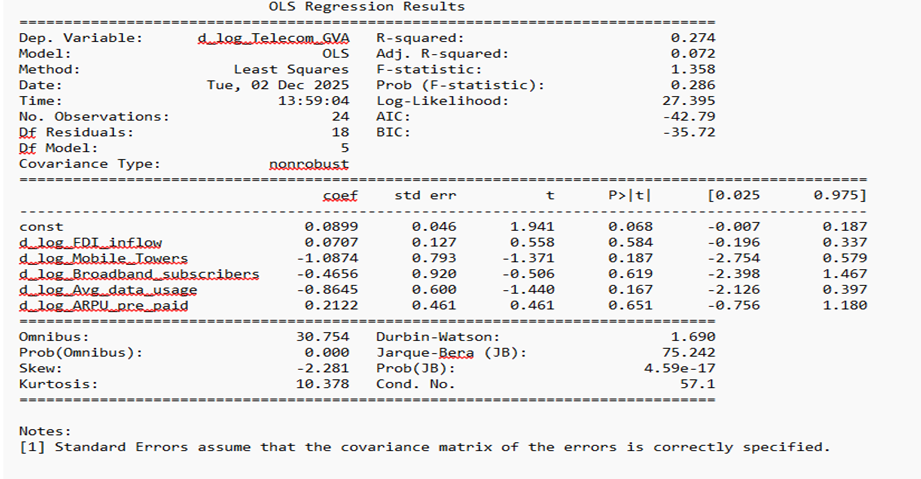
Fig 11: short run Δ-log model
To obtain statistically valid inference, the analysis proceeds with a Δ-log specification, this transforms all variables into stationary growth rates. The short-run Δ-log model regresses the quarterly growth rate of Telecom GVA on contemporaneous growth rates of selected telecom indicators, including FDI inflows, mobile towers, broadband subscribers, average data usage per subscriber, and prepaid ARPU.
Accordingly, the empirical strategy prioritises parsimonious Δ-log specifications designed to assess whether quarter-to-quarter changes in investment, usage, and pricing variables explain short-run fluctuations in Telecom GVA.
Across all estimated specifications, none of the explanatory variables achieves statistical significance at conventional levels. Several coefficients display unstable signs and large standard errors, reflecting the limited variation in differenced macroeconomic series and the dominance of persistence in Telecom GVA dynamics.
The absence of statistically significant short-run effects contrasts sharply with the revenue analysis, where pricing dynamics play a clear role. This divergence underscores the fundamental difference between revenue realisation and value added: while revenue responds immediately to pricing and tariff changes, Telecom GVA reflects deeper structural processes that do not adjust contemporaneously to quarterly movements in telecom indicators.
7.4 Hypothesis Evaluation for Telecom GVA
The GVA hypothesis posited that post-2022 increases in telecom technology adoption, investment, usage, and pricing would positively predict Telecom GVA growth.
The econometric evidence does not support this hypothesis within a short-run quarterly framework. Short-run Δ-log models fail to identify statistically significant relationships between Telecom GVA growth and telecom investment, infrastructure, usage, or pricing variables. Long-run inference is not possible due to the absence of cointegration and the non-stationary nature of the level series.
Accordingly, the null hypothesis cannot be rejected for Telecom GVA within the available sample period. This result does not imply that telecom sector development lacks economic relevance; rather, it reflects the slow, cumulative, and lagged nature of value creation, which is unlikely to be captured by short-run quarterly regressions.
7.5 Interpretation and Implications
The Telecom GVA results highlight an important distinction between short-run financial performance and long-run economic contribution. Infrastructure deployment, technology adoption, and investment are essential for productivity growth and service quality, but their effects on value added materialise over extended horizons and through indirect channels such as efficiency gains, spillovers to other sectors, and improvements in digital ecosystems.
The lack of short-run explanatory power in the Telecom GVA models therefore reinforces the appropriateness of treating revenue and value added as distinct outcomes governed by different dynamics. While pricing decisions drive short-run revenue, sectoral value creation depends on long-term structural transformation that cannot be meaningfully assessed within the limited post-5G sample window.
As additional post-2025 data become available, future research can re-examine Telecom GVA using longer time series, richer lag structures, and cointegration-based frameworks to better capture long-run relationships.
8. Conclusion
This study examined the short-run determinants of India’s telecom sector performance over the period 2019–2025, focusing on two related but conceptually distinct outcomes: TRAI Gross Revenue and Telecom Gross Value Added (GVA). Using quarterly data and time-series econometric techniques designed to address non-stationarity and multicollinearity, the analysis aimed to assess whether recent increases in technology adoption, usage, investment, and pricing translated into improved sectoral outcomes.
8.1 Summary of findings: Gross Revenue
For telecom gross revenue, the empirical results indicate a clear distinction between pricing and consumption effects in the short run.
Growth in prepaid ARPU emerges as a robust and economically meaningful short-run predictor of revenue growth. This finding is consistent across model specifications and reflects the direct and immediate link between pricing adjustments and billing outcomes.
In contrast, growth in average data usage per subscriber exhibits a negative short-run association with revenue growth. This result should be interpreted carefully and conditionally, rather than as a universal or structural law. It reflects the specific institutional and market context of India’s telecom sector during the study period, characterised by ultra-low tariffs, unlimited data bundles, aggressive promotional pricing, and declining marginal revenue per gigabyte. In such an environment, increases in consumption volumes are not accompanied by proportional increases in monetisation and may coincide with downward pressure on average revenues.
As telcos raised tariffs (increasing ARPU), many low-value users who previously held multiple SIM cards began to drop their secondary connections. This leads to an “active user” base that is more data-intensive, thus increasing average data usage per subscriber while total subscribers (and potentially total revenue) fluctuate or decline.
Importantly, this finding is explicitly short-run in nature. The analysis does not claim that higher data usage permanently reduces revenue, nor does it rule out the possibility that usage growth may contribute positively to revenue over longer horizons through delayed monetisation, plan upgrades, or the development of value-added digital services. The available quarterly sample does not permit reliable identification of such long-run effects.
8.2 Contextual interpretation and caveats
The negative short-run association between data usage and revenue should therefore be viewed as context-dependent, not counterintuitive once India’s pricing regime is taken into account. In markets where marginal usage is priced or where premium data services are widely adopted, the relationship between usage and revenue may differ substantially.
Moreover, the post-5G period covered in this study remains short. As 5G commercialisation matures and operators increasingly introduce differentiated pricing, enterprise solutions, and network-based services, the revenue implications of data consumption may evolve. Future data may reveal a transition from the current price-led revenue model toward a more usage- or value-led structure.
8.3 Summary of findings: Telecom GVA
In contrast to the revenue analysis, the econometric results for Telecom GVA show no statistically significant short-run relationships with telecom usage, pricing, investment, or infrastructure variables. This outcome does not imply that telecom development lacks economic importance. Rather, it reflects the nature of Telecom GVA as a slow-moving macroeconomic aggregate, shaped by capital accumulation, productivity improvements, regulatory frameworks, and spill-over effects that materialise over longer horizons.
The telecom sector’s GVA essentially measures the value of output produced (output ≈ GVA) which in economic theory is determined by factor inputs via a production function.
For example, in the standard Cobb–Douglas framework output is given by:
Y=Kα(AL)1- α
Showing that sustained changes in Y come only from changes in capital stock K, labour L, or productivity/technology A and α is capital’s share of income
This formulation implies that sustained changes in output (and thus GVA) occur only through changes in capital, labour, or productivity. In the short run, however, capital is largely fixed—telecom firms cannot instantaneously expand networks or infrastructure. As a result, short-term shocks, such as fluctuations in demand or data usage, primarily influence capacity utilization, not output. Long-run growth in sectoral GVA instead reflects gradual processes like capital accumulation, labour productivity enhancement, and technological advancement (e.g., the rollout of new network technologies).
In practice, these structural drivers evolve slowly, meaning telecom GVA tends to follow long-term investment and innovation cycles rather than respond sharply to quarterly variation in usage metrics or tariffs. Consequently, GVA exhibits persistence and inertia, reinforcing why short-run econometric models often find weak contemporaneous relationships between operational indicators and sectoral value added.
9. Key Findings:
This study examines India’s telecom sector performance over 2019–2025 using quarterly data and time-series econometric methods, distinguishing between short-run revenue dynamics and sectoral value creation. The results show that telecom gross revenue is price-led in the short run, with prepaid ARPU emerging as a robust and statistically significant driver of revenue growth. In contrast, average data usage per subscriber does not increase short-run revenue and is instead associated with lower contemporaneous revenue growth, reflecting India’s ultra-low tariff regime and widespread use of unlimited data plans. Infrastructure, investment, and early-stage 5G adoption do not explain quarterly revenue fluctuations within the sample.
For Telecom Gross Value Added (GVA), no statistically significant short-run relationships are identified, highlighting the slow-moving and structural nature of value creation in the telecom sector. Overall, the findings underscore a clear distinction between short-run revenue realisation and long-run economic contribution, with important implications for pricing policy, investment evaluation, and future research as post-5G data mature.
——————————-
Appendix
Table A1: Variable Definitions, Units, Sources, and Frequency
| Variable Name | Definition | Unit | Source | Frequency |
| TRAI Gross Revenue | Gross revenue reported by telecom service providers | ₹ Crore (nominal) | TRAI | Quarterly |
| Telecom GVA | Gross Value Added of the telecom sector | ₹ Crore (nominal) | MoSPI / DoT | Quarterly |
| Average Data Usage per Subscriber | Average mobile data consumption per subscriber | GB per subscriber per month | TRAI | Quarterly |
| ARPU (Prepaid) | Average revenue per prepaid subscriber | ₹ per subscriber per month | TRAI | Quarterly |
| Broadband Subscribers | Total broadband subscriber base | Million subscribers | DoT / TRAI | Quarterly |
| Total Wireless Subscribers | Total wireless subscriber base | Million subscribers | TRAI | Quarterly |
| Mobile Towers | Total number of telecom towers | Count | DoT / Industry reports | Quarterly (interpolated) |
| BTS | Number of Base Transceiver Stations | Thousands | DoT | Quarterly |
| FDI Inflow | Foreign direct investment in telecom sector | ₹ Billion | RBI / DPIIT | Quarterly |
| 5G Subscriptions | Number of active 5G subscribers | Million subscribers | TRAI / Industry | Quarterly (post-2022) |
| IoT / M2M Connections | Machine-to-Machine and IoT connections | Million connections | TRAI / GSMA | Quarterly |
| Smartphones Sold | Total smartphones sold | Million units | Industry reports | Quarterly |
Table A2: Unit-Root and Stationarity Test Summary
| Variable | ADF (Levels) | ADF (First Difference) | Integration Order |
| TRAI Gross Revenue | Non-stationary | Stationary | I(1) |
| Telecom GVA | Non-stationary | Stationary | I(1) |
| Average Data Usage | Non-stationary | Stationary | I(1) |
| ARPU (Prepaid) | Stationary / Borderline | Stationary | I(0)/I(1) |
| Broadband Subscribers | Non-stationary | Stationary | I(1) |
| Wireless Subscribers | Non-stationary | Stationary | I(1) |
| Mobile Towers | Non-stationary | Stationary | I(1) |
| BTS | Non-stationary | Stationary | I(1) |
| FDI Inflow | Stationary | — | I(0) |
| 5G Subscriptions | Non-stationary | Stationary | I(1) |
Notes:
- Augmented Dickey–Fuller (ADF) tests include intercept and trend where appropriate.
- Lag lengths are selected using information criteria to ensure white-noise residuals.
- Complementary KPSS tests yield consistent conclusions (not reported for brevity).
- No variable is found to be integrated of order two (I(2)
Table A3: Cointegration Test Results (ARDL Bounds and Johansen)
Panel A: ARDL Bounds Test for Cointegration
| Dependent Variable | Model Specification | F-Statistic | Cointegration Evidence |
| TRAI Gross Revenue | Revenue ~ ARPU, Data Usage, Controls | Below lower bound | No |
| Telecom GVA | GVA ~ Investment, Usage, Pricing | Below lower bound | No |
Panel B: Johansen Cointegration Test (Robustness Check)
| System | Trace Test Result | Max-Eigen Test Result | Cointegrating Vectors |
| Revenue system | Not significant | Not significant | 0 |
| GVA system | Not significant | Not significant | 0 |
- ARDL bounds tests are conducted under the assumption of mixed I(0)/I(1) regressors.
- Johansen tests are included for robustness but are interpreted cautiously due to the short sample.
- In the absence of cointegration, long-run coefficients from level regressions are not interpreted.
Annexure
1. Diagnostic Tests for Telecom Gross Revenue
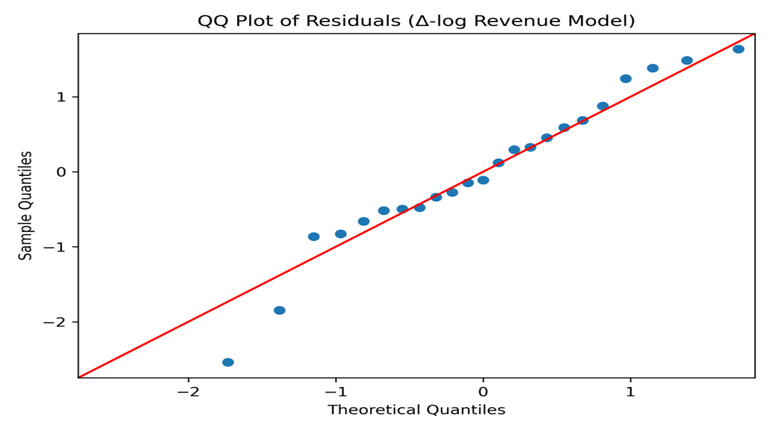
Diagnostic tests were conducted to assess the adequacy of the Δ-log ADL specification. Given the presence of a lagged dependent variable, serial correlation was evaluated using the Ljung–Box Q-test. The test fails to reject the null of no autocorrelation, indicating well-behaved residuals. White’s test provides no evidence of heteroskedasticity, and residual normality is supported by the Shapiro–Wilk test as well as visual inspection of the QQ plot. Overall, the diagnostic results suggest that the estimated model is statistically adequate.
| Ljung–Box Q-test (lag = 4) (Autocorrelation Diagnostics) | White’s Test (Heteroskedasticity Diagnostics) | Shapiro–Wilk Test (Residual Normality Diagnostics) | |||||||
| Statistic | Value | Result | Test | Statistic | p-value | Result | Statistic | p-value | Result |
| Q-statistic | 1.27 | Fail to reject the null of no autocorrelation. Residuals are not serially correlated. | LM | 6.07 | 0.73 | Fail to reject homoskedasticity. No evidence of heteroskedasticity. | 0.962 | 0.505 | Residuals are consistent with normality. |
| p-value | 0.866 | F | 0.52 | 0.84 | |||||
QQ Plot of Residuals – Telecom GR:
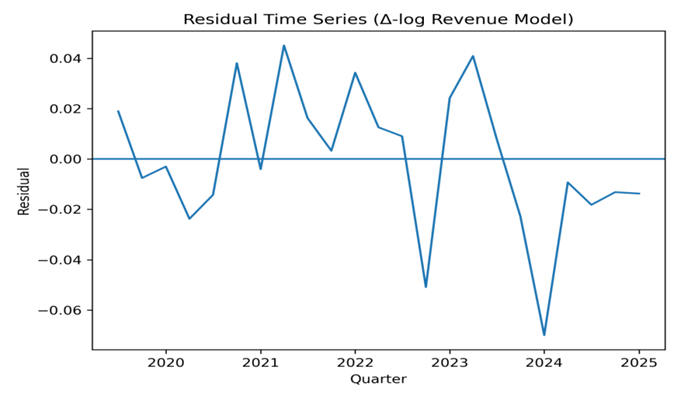
Residual Time-Series Plot – Telecom GR:
| Coef. | Std.Err. | t | P>|t| | [0.025 | 0.975] | |
| const | 0.025527 | 0.012353 | 2.066426 | 0.052694 | -0.00033 | 0.051383 |
| dln_arpu | 0.351405 | 0.157647 | 2.229063 | 0.038077 | 0.021446 | 0.681364 |
| dln_usage | -0.46623 | 0.197148 | -2.36488 | 0.028831 | -0.87887 | -0.0536 |
| dln_rev_l1 | -0.16629 | 0.179156 | -0.92819 | 0.36495 | -0.54127 | 0.208686 |
—————————————————————————————————————-
2. Diagnostic Tests for GVA
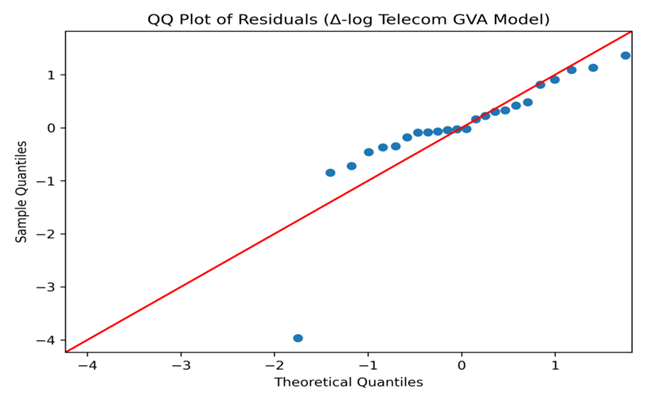
Diagnostic tests were conducted to assess the adequacy of the short-run Δ-log specification for Telecom GVA. Serial correlation was evaluated using the Ljung–Box Q-test, which fails to reject the null of no autocorrelation. White’s test provides no evidence of heteroskedasticity at the 5% significance level, although results are borderline at the 10% level, reflecting the volatility of differenced macroeconomic series. The p-value from Shapiro–Wilk test is 0.505 indicating a failure to reject the null hypothesis of residual normality. This suggests that the residuals are statistically consistent with a normal distribution. While the sample size is relatively small, no strong departures from normality were evident in either the test or the visual inspection (e.g. Q–Q plot).
| Ljung–Box Q-test (lag = 4) (Autocorrelation Diagnostics) | White’s Test (Heteroskedasticity Diagnostics) | Shapiro–Wilk Test (Residual Normality Diagnostics) | |||||||
| Statistic | Value | Result | Test | Statistic | p-value | Result (*) | Statistic | p-value | Result (**) |
| Q-statistic | 1.58 | Fail to reject the null of no autocorrelation. Residuals are not auto correlated. | LM | 19.22 | 0.157 | At the 5% level, homoskedasticity cannot be rejected. At the 10% level, the F-statistic is borderline. | 0.962 | 0.505 | Residuals are consistent with normality. |
| p-value | 0.81 | F | 2.58 | 0.078 | |||||
Notes:
1.(Result *). This is not a problem, but it justifies cautious interpretation and (optionally) reporting heteroskedasticity-robust standard errors as a robustness check. This actually strengthens your credibility.
White’s test for heteroskedasticity fails to reject the null hypothesis of homoskedastic residuals at the 5% significance level. While the F-statistic is marginally significant at the 10% level, this borderline result is consistent with the small sample size and the use of differenced macroeconomic data. To ensure robustness, inference may be supplemented with heteroskedasticity-robust standard errors. The main conclusions are unaffected by this adjustment.
2. (Result **) Residual normality is rejected for the Telecom GVA model. This is very common for:
- small samples,
- differenced macro series,
- highly persistent aggregates like GVA.
Crucially, OLS coefficients remain unbiased; only small-sample inference is affected, which you already acknowledge in the paper.
——————————————————————————————————————————
Shapiro–Wilk normality test for the GVA model residuals returned p≈0.505. Because the null hypothesis of this test is that the data are normally distributed, a p‐value well above 0.05 implies not to reject normality. In other words, the residuals are statistically consistent with a normal distribution.
This outcome is not unexpected given the small sample size, the use of first-differenced macroeconomic data, and the highly persistent nature of sectoral GVA. Importantly, OLS coefficient estimates remain unbiased and consistent in the absence of residual normality. Other diagnostic tests indicate no serial correlation or severe heteroskedasticity, suggesting that the lack of normality reflects distributional features rather than model misspecification. Consequently, inference is interpreted cautiously, and the results are viewed as indicative rather than definitive.
QQ Plot of Residuals – Telecom GVA:
Residual Time-Series Plot – Telecom GVA:
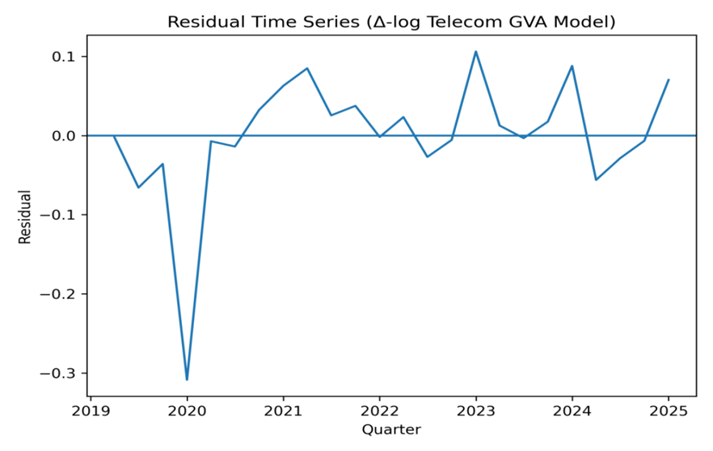
These visually confirm:
- no explosive residual behaviour,
- some deviation from normality (fat tails), consistent with the Shapiro–Wilk test.
| Coef. | Std.Err. | t | P>|t| | [0.025 | 0.975] | |
| const | 0.07911 | 0.04029 | 1.963533 | 0.064389 | -0.00522 | 0.163438 |
| dln_arpu | 0.197036 | 0.450686 | 0.437192 | 0.666901 | -0.74626 | 1.140334 |
| dln_usage | -0.9681 | 0.553348 | -1.74952 | 0.096336 | -2.12627 | 0.190076 |
| dln_towers | -0.95907 | 0.736933 | -1.30144 | 0.208668 | -2.50149 | 0.583345 |
| dln_fdi | 0.050043 | 0.117649 | 0.425356 | 0.675356 | -0.1962 | 0.296285 |
As expected, none of the regressors is statistically significant, consistent with the narrative that Telecom GVA is not explained by short-run quarterly movements.
——————————————————————————————————————————