
Every day, millions of Indians begin and end their journeys on foot. Children walk to schools, workers make their way to bus stops and railway stations, senior citizens take their morning walks, and shoppers weave through busy market streets. Walking is the oldest, simplest and most inclusive mode of transport. Yet, it is also the most vulnerable. Unlike motorists protected by airbags, seat belts and steel frames, pedestrians have little to shield them from the force of a speeding vehicle.
In recent years, the safety of pedestrians has received increasing public attention. The Supreme Court’s recognition of the Right to Walk as an integral part of the constitutional right to life has reinforced the responsibility of governments to provide safe footpaths, crossings and pedestrian-friendly streets. Across India, discussions on road safety have consequently focused on improving pedestrian infrastructure and reducing road fatalities.
At first glance, the available statistics appear to paint an alarming picture for Kerala. More than one in every four persons killed in road accidents in the State is a pedestrian—a proportion higher than that of the neighbouring southern states. Such a figure naturally creates the impression that Kerala is one of the most dangerous places in India for those who walk.
However, a closer examination of the data reveals a far more intriguing picture.
Compared with Tamil Nadu, Karnataka and Telangana, Kerala records the lowest absolute number of pedestrian fatalities. More remarkably, Kerala also records the lowest Accident Severity Index among the four states—and indeed among all Indian states. In simple terms, while road accidents occur frequently in Kerala, they are far less likely to result in death than elsewhere. On average, one person dies for about every thirteen reported road accidents in Kerala, whereas several neighbouring states record nearly one death for every three to five accidents.
This raises an important question. How can a state where pedestrians account for the highest share of accident victims also be the state where accident outcomes are the least severe?
This apparent contradiction forms what may be called the Kerala Pedestrian Safety Paradox.
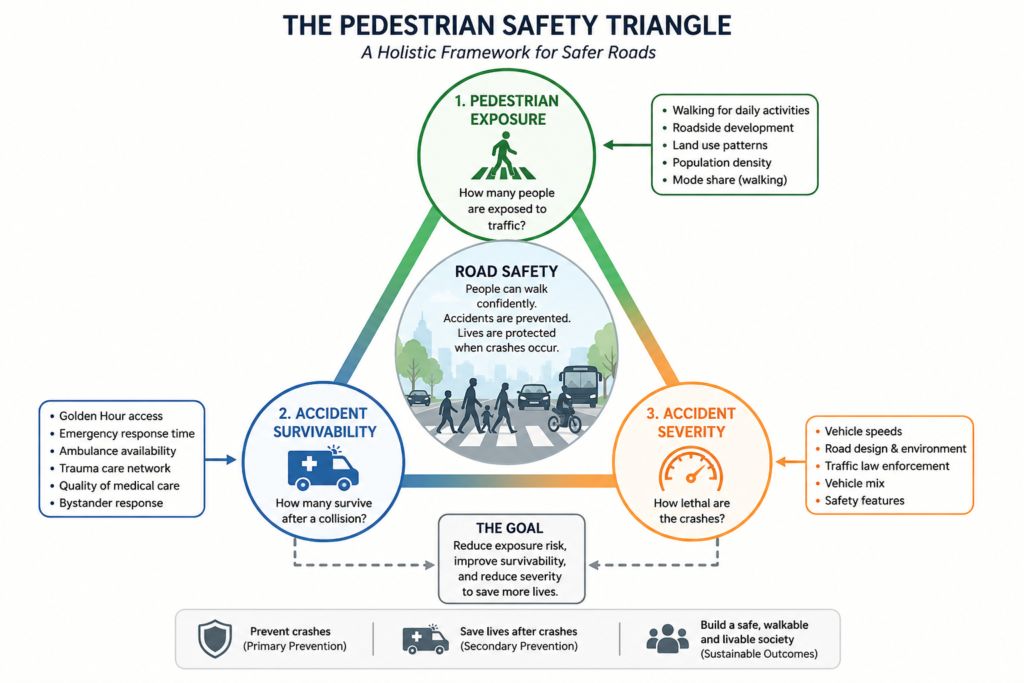
Three dimensions to evaluate the safety of pedestrians.
The answer may lie in looking beyond the conventional measure of counting fatalities. Road safety is not determined solely by how many people die. It is also shaped by how many people are exposed to traffic, how severe collisions become, and how likely accident victims are to survive after a crash. These three dimensions—pedestrian exposure, accident severity and accident survivability—offer a more comprehensive way of understanding pedestrian safety than absolute fatality counts alone.
Kerala presents a unique setting for such an examination. Unlike many Indian states where cities are separated by large rural stretches, Kerala has evolved into an almost continuous urban corridor extending across much of the state. Residential areas, schools, markets, hospitals, bus stops and commercial establishments are closely integrated with the road network. As a result, pedestrians are present almost everywhere, throughout the day. This pattern of development increases pedestrian exposure, meaning that a larger proportion of the population interacts with moving traffic during their daily activities.
Yet the same pattern of development may also contribute to improved survival after an accident. The state’s dense network of hospitals, relatively short distances to trauma-care facilities, widespread emergency medical services, and extensive enforcement of speed limits through AI-enabled traffic cameras may collectively reduce the severity of crashes and improve the chances of survival during the critical ‘Golden Hour’ following an accident. While these factors have often been discussed individually, their combined influence on pedestrian safety has rarely been examined in a comparative framework.
This article does not attempt to establish a definitive causal relationship between these factors and Kerala’s road safety outcomes. Rather, it presents an exploratory analysis of an important policy question. By comparing Kerala with the neighbouring states of Tamil Nadu, Karnataka and Telangana, the article seeks to examine whether conventional road safety statistics tell the complete story, or whether they conceal a deeper relationship between urbanisation, pedestrian exposure, accident severity and post-crash survivability.
Understanding this relationship is more than an academic exercise. As India continues to urbanise and invests heavily in transport infrastructure, the challenge is not merely to reduce the number of accidents but also to create roads where people can walk safely and, when accidents do occur, have the greatest possible chance of survival. If Kerala’s experience offers lessons in this regard, they could have significant implications for road safety policy across the country.
The journey towards answering these questions begins with a simple observation: sometimes the most revealing statistics are not those that confirm our assumptions, but those that challenge them.
Paradox One: When the Numbers Tell Different Stories
Road safety is usually measured using a single indicator—the number of people killed in road accidents. While this measure is useful, it often hides important dimensions of risk. A closer examination of pedestrian fatalities across the four southern states—Kerala, Tamil Nadu, Karnataka and Telangana—reveals that the available statistics do not tell a single, consistent story. Instead, they present three apparently contradictory pictures of pedestrian safety.
Story One: Kerala Records the Lowest Number of Pedestrian Deaths
If absolute numbers alone are considered, Kerala appears to be the safest among the four southern states. Tamil Nadu consistently records the highest number of pedestrian fatalities in India, followed by Karnataka and Telangana. Kerala, despite its dense population and extensive road network, records the lowest number of pedestrians killed in road accidents.
| Region / Metric | 2023 Deaths | 2024 Deaths | 2025 Deaths (Provisional) |
| All-India Total | 35,221 | 36,526 | 37,200+ |
| Tamil Nadu (Highest Absolute) | 4,500+ | 4,712 | 4,900+ |
| Karnataka | 2,418 | 2,321 | 2,450+ |
| Telangana | 1,554 | 1,610+ | 1,650+ |
| Kerala | ~1,100 | 1,072 | 851 |
Table 1- Pedestrian fatalities in road accidents
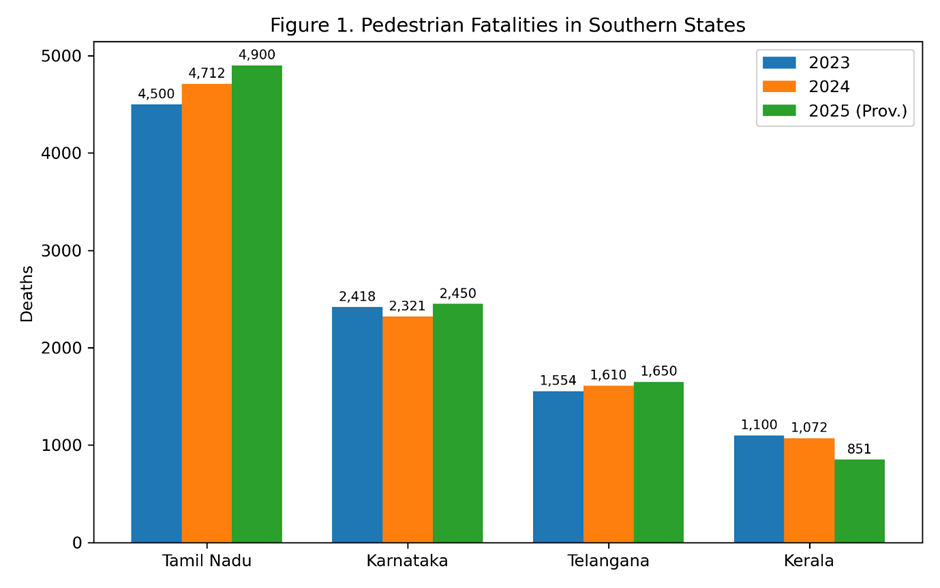
At first sight, this seems surprising. Kerala is one of the most densely inhabited regions in the country. Its settlements are spread continuously along roads, with shops, schools, hospitals, places of worship and public transport stops located within walking distance of residential areas. One would therefore expect a larger number of pedestrians to be exposed to traffic and, consequently, a higher number of pedestrian fatalities.
Yet the official statistics point in the opposite direction.
If the number of pedestrian deaths alone is taken as the measure of safety, Kerala appears to outperform its neighbouring states.
Story Two: Kerala Has the Highest Share of Pedestrian Fatalities
The picture changes completely when a different indicator is used. Instead of asking “How many pedestrians died?”, we ask “What proportion of all road accident deaths were pedestrians?”
| Region / Metric | 2023 Share | 2024 Share | 2025 Share | 3-Year Average Ratio % | |||
| Pedestrian | Total | Pedestrian | Total | Pedestrian | Total | ||
| All-India Total | 35,221 | 1,72,850 | 36,526 | 1,77,175 | 37,200 | 1,81,000 | 20.60% |
| Kerala | 1,100 | 4,084 | 1,072 | 3,880 | 851 | 3,733 | 25.80% |
| Tamil Nadu | 4,500 | 18,347 | 4,712 | 18,449 | 4,900 | 18,600 | 25.20% |
| Telangana | 1,554 | 7,920 | 1,610 | 8,110 | 1,650 | 8,250 | 19.80% |
| Karnataka | 2,418 | 11,540 | 2,321 | 11,620 | 2,450 | 11,800 | 20.10% |
Table 2- Pedestrian fatalities as a share of total accident deaths
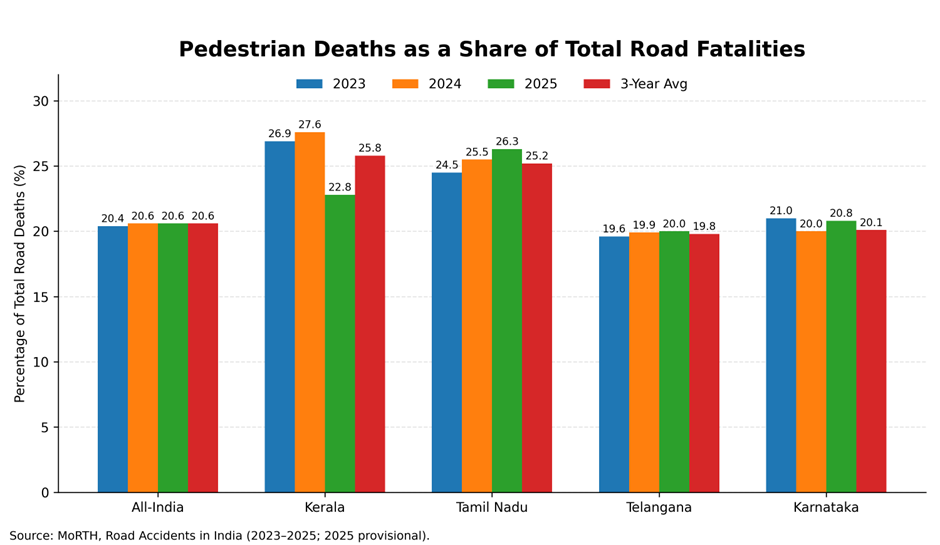
Kerala, which appeared safest in the previous table, now ranks highest.
Nearly 26 per cent of all persons killed in road accidents in Kerala are pedestrians, compared with around 25 per cent in Tamil Nadu and about 20 per cent in Karnataka and Telangana.
This statistic appears to suggest exactly the opposite conclusion.
If more than one out of every four accident victims in Kerala is a pedestrian, does it mean that Kerala is actually more dangerous for people who walk?
Not necessarily.
The contradiction arises because the two tables measure different aspects of road safety. First table measures ‘How many pedestrians died’. Second table measures ‘How large a proportion of all accident victims were pedestrians.’ The first table suggested Kerala was safest. The second suggested it was most dangerous.
Neither tells us ‘How many pedestrians were actually exposed to traffic’. This naturally leads into the next section that would reconcile these seemingly contradictory observations.
Story Three: Kerala Has the Lowest Accident Severity
A third indicator changes the picture once again.
The Accident Severity Index measures the number of persons killed for every one hundred reported road accidents. Unlike absolute fatality counts, this indicator examines the outcome of accidents rather than their frequency.
The table below outlines the lethal density of road accidents across the target regions, emphasizing the sharp divergence in regional survival odds:
| Region / State | 2023 Severity Index | 2024 Severity Index | 2025 Severity Index (Est.) | Risk Interpretation |
| All-India Average | 36 | 36.3 | 36.7 | Over 1 death for every 3 crashes nationwide. |
| Telangana | 33.4 | 30.6 | 31.1 | Highest southern severity; notable improvement in 2024. |
| Karnataka | 22 | 23.1 | 23.4 | Rising index; high fatality conversion on highway outskirts. |
| Tamil Nadu | 22.2 | 22.5 | 22.8 | Highest absolute crashes, but a steady severity due to quick tracking. |
| Kerala | 7.9 | 7.6 | 7.5 | Lowest nationwide; 1 death per 13 crashes. |
Table 3- Accident Severity Index (death toll for every one hundred road accidents)
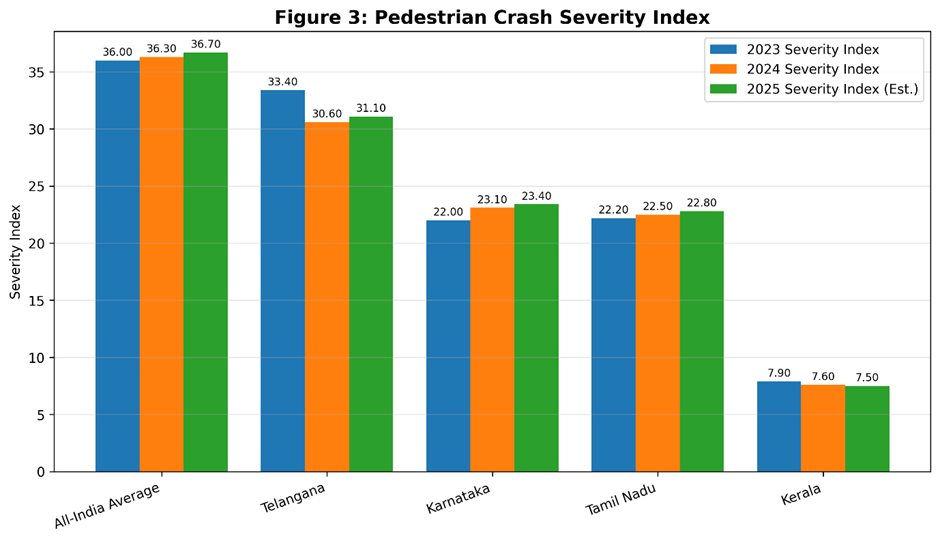
Each of these three indicators is correct. Yet each tells a different story.
The first suggests that Kerala is comparatively safe because fewer pedestrians die.
The second suggests that pedestrians constitute a disproportionately large share of road accident victims.
The third indicates that once an accident occurs, the chances of survival are considerably higher in Kerala than in the neighbouring states.
Viewed individually, these statistics appear contradictory. Viewed together, however, they reveal something far more interesting.
They suggest that pedestrian safety cannot be understood by relying on a single measure. Instead, it must be examined through three complementary dimensions:
- Pedestrian Exposure – How many people are exposed to road traffic during their daily activities.
- Accident Severity – How likely a road accident is to result in a fatality.
- Accident Survivability – How likely an accident victim is to survive after a collision.
These three dimensions form the conceptual framework for understanding what this article describes as the Kerala Pedestrian Safety Paradox.
Understanding Pedestrian Exposure: Looking Beyond the Death Toll
Pedestrian exposure refers to the extent to which people are present on or near roads and are therefore exposed to moving traffic. Every time a person walks to a nearby shop, crosses a road to board a bus, escorts a child to school, or takes an evening walk, that individual is exposed to traffic. The greater the number of people walking and the longer they remain in contact with moving vehicles, the greater the pedestrian exposure.
Imagine two hypothetical states.
In the first state, people rarely walk. Most journeys are made using private vehicles, and residential areas are separated from commercial centres by long distances. Pedestrians are relatively few, and exposure to traffic is limited.
In the second state, people walk throughout the day. Shops, schools, hospitals, bus stops and places of work are located within short distances of residential neighbourhoods. Roads are shared continuously by pedestrians, cyclists, buses, cars and two-wheelers. Pedestrian exposure is therefore much higher.
Even if both states record the same number of pedestrian fatalities, the implications are entirely different. In the first state, each pedestrian may actually face a higher individual risk because relatively few people are walking. In the second state, a much larger population is exposed to traffic every day, making pedestrian involvement in accidents almost inevitable.
Kerala is unlike most Indian states in its pattern of development. Rather than growing around a few large cities surrounded by extensive rural areas, much of Kerala has evolved into a nearly continuous urban corridor stretching across the State. Residential areas merge into commercial establishments, schools stand beside highways, hospitals are located within densely populated neighbourhoods, and bus stops serve communities distributed almost continuously along the road network.
This pattern of ribbon development means that pedestrians are rarely absent from Kerala’s roads. Walking is not confined to city centres. It is an essential part of everyday life across towns, villages and suburban settlements. A person travelling by bus walks to the bus stop. A shopper walks to the neighbourhood market. Schoolchildren, office workers, senior citizens and tourists all become part of the pedestrian environment.
Consequently, Kerala experiences an exceptionally high level of pedestrian exposure.
Seen in this light, the finding that pedestrians constitute nearly twenty-six per cent of all road accident fatalities begins to acquire a different meaning. It does not necessarily imply that Kerala’s roads are inherently more dangerous for pedestrians. Rather, it may reflect the simple reality that pedestrians form a much larger and more visible component of the transport system than in many other states.
This observation leads to an important distinction between pedestrian exposure and pedestrian vulnerability.
Exposure answers the question:
How many people are placed in contact with moving traffic?
Vulnerability asks a different question:
Once exposed, how likely are they to suffer a fatal outcome?
The objective should not merely be to reduce pedestrian presence on roads. Walking is an essential, healthy and environmentally sustainable mode of transport. Instead, the objective should be to ensure that a high level of pedestrian exposure does not translate into a high probability of death.
This is precisely where Kerala presents an interesting policy question. If the State experiences one of the highest levels of pedestrian exposure in India while simultaneously recording one of the lowest Accident Severity Indexes, what factors enable so many accident victims to survive?
The answer may lie not only in preventing accidents, but also in improving what happens after an accident occurs. This introduces the next dimension of the Kerala Pedestrian Safety Paradox—accident survivability.
Understanding Accident Survivability: When Road Safety Depends on What Happens After the Crash
For decades, road safety has been measured primarily by one objective—preventing accidents. Governments invest in better roads, stricter traffic laws, improved vehicle safety standards and public awareness campaigns, all with the aim of reducing the number of crashes.
These efforts are essential. Yet they tell only part of the story.
Every road accident has two distinct stages. The first is the collision itself. The second begins immediately afterwards—the struggle to save human life. Whether an injured pedestrian survives often depends not only on the force of the impact but also on what happens during the minutes that follow.
This second stage may be described as accident survivability.
Accident survivability refers to the probability that a person involved in a road crash survives the injuries sustained. It recognises that the outcome of a collision is influenced by several interconnected factors beyond the accident itself. Vehicle speed at the moment of impact, the severity of injuries, the availability of bystanders, ambulance response time, proximity to trauma-care facilities, and the quality of emergency medical treatment all contribute to determining whether a victim lives or dies.
In other words, road safety does not end when a crash occurs. It continues until the injured person either recovers or succumbs to the injuries.
This perspective offers a different way of interpreting Kerala’s road safety statistics.
Although pedestrians constitute a relatively high proportion of accident victims in Kerala, the State records one of the lowest Accident Severity Indexes in the country. This suggests that while pedestrians may be involved in accidents more frequently because of their greater exposure to traffic, a significantly larger proportion survive those accidents.
What might explain this difference?
One possible explanation lies in what may be called Kerala’s Survival Ecosystem—a combination of geographical, infrastructural and institutional factors that together improve the chances of survival after a serious road crash.
The first element is the Golden Hour.
Emergency medicine recognises the first sixty minutes after a traumatic injury as the most critical period for saving life. Patients who receive definitive medical treatment within this window have substantially higher survival rates than those whose treatment is delayed. Kerala’s pattern of development, characterised by closely spaced towns and a dense network of hospitals, places specialised medical care within relatively short travelling distances for a large proportion of the population. Unlike regions where accidents may occur many kilometres from the nearest trauma centre, much of Kerala lies within practical reach of emergency medical facilities.
The second element is lower operating speeds.
Kerala’s roads are often criticised for congestion, narrow carriageways and slower traffic movement. From the perspective of motorists, these are seen as weaknesses. From the perspective of pedestrian safety, however, they may produce an unintended advantage.
The severity of a collision increases dramatically with vehicle speed. A pedestrian struck at lower speeds has a significantly greater chance of survival than one hit by a vehicle travelling at highway speeds. Kerala’s winding roads, continuous roadside development, frequent intersections and extensive AI-based speed enforcement naturally discourage sustained high-speed driving across much of the road network. While these conditions may increase travel time, they also reduce the kinetic energy released during collisions.
The third element is rapid access to emergency services.
Kerala’s relatively compact geography enables ambulances, police personnel and local residents to reach accident sites more quickly than may be possible in sparsely populated regions. High population density means that accidents are more likely to be witnessed promptly, allowing emergency services to be alerted without delay. Immediate first aid, faster transportation and quicker admission to hospitals all contribute to improving survival outcomes.
Taken together, these factors create what may be described as a survival ecosystem—an environment in which the probability of surviving a road accident is substantially enhanced.
Traditionally, safer roads have been defined as roads where fewer accidents occur.
An equally important measure may be roads where more people survive.
The two objectives are complementary rather than competing. A transport system should strive both to prevent collisions and to maximise survival when prevention fails.
If this interpretation is correct, Kerala’s experience offers an important lesson. The State’s success may not lie simply in reducing accidents, but in reducing the likelihood that an accident becomes fatal. Understanding how this survival ecosystem operates—and identifying which of its components have the greatest influence—will be an important direction for future research and policy development.
Understanding Accident Severity: Measuring the Human Cost of Road Accidents
When people compare road safety across states, they usually begin with two simple questions.
How many accidents occurred?
How many people died?
While both statistics are important, neither tells us how lethal a road transport system actually is. A state may report a large number of accidents simply because it has a larger population, a greater number of vehicles, or better accident reporting. Another state may record fewer accidents but a much higher proportion of deaths because crashes occur at higher speeds or emergency medical care is less accessible.
To understand the true human cost of road accidents, another measure is required.
This measure is known as the Accident Severity Index (ASI).
The Accident Severity Index represents the number of persons killed for every one hundred reported road accidents. Rather than measuring how frequently accidents occur, it measures how deadly those accidents become.
This distinction is fundamental.
Imagine two states, each recording one thousand road accidents in a year.
In the first state, seventy-five people lose their lives.
In the second state, more than three hundred people are killed.
Although both states experienced the same number of accidents, the outcomes are dramatically different. The first state has created conditions in which many accident victims survive. The second has not.
The Accident Severity Index captures this difference.
Viewed from this perspective, Kerala presents one of the most interesting road safety profiles in India.
The State consistently records the lowest Accident Severity Index not only among the four southern states but also at the national level. On average, approximately one person dies for every thirteen reported road accidents in Kerala. In neighbouring states, fatalities occur far more frequently for a similar number of accidents.
This finding challenges a common assumption about road safety.
Congested roads are often criticised because they increase travel time and contribute to frequent minor collisions. However, congestion also reduces average vehicle speeds. Lower speeds reduce the kinetic energy transferred during a collision, making serious injuries less likely. In effect, roads that appear inefficient from a transport perspective may produce safer outcomes from a public health perspective.
The relationship between speed and survival is well established. A pedestrian struck by a vehicle travelling at high speed is far less likely to survive than one struck at a lower speed. Even modest reductions in operating speed can significantly improve survival rates because the force of impact increases disproportionately with speed.
Kerala’s road environment naturally limits sustained high-speed driving. Narrow carriageways, frequent intersections, roadside commercial activity, continuous ribbon development, heavy traffic volumes and extensive AI-based speed enforcement combine to moderate average travel speeds across much of the State. Although these conditions cannot prevent every accident, they may substantially reduce the severity of injuries when collisions occur.
The significance of the Accident Severity Index therefore extends beyond statistics. It shifts attention from accident occurrence to accident outcomes. Instead of asking only “How many accidents happened?”, it asks an equally important question:
“How many of those accidents proved fatal?”
This change in perspective has important policy implications.
Traditional road safety programmes focus primarily on reducing accident numbers. While this remains an essential objective, the Kerala experience suggests that reducing the severity of accidents may be equally important. If lower operating speeds, rapid trauma care, and effective emergency response can transform potentially fatal crashes into survivable incidents, then investments in these areas deserve as much attention as investments in new roads and traffic enforcement.
Seen in this context, the Accident Severity Index becomes more than a statistical indicator. It serves as a measure of the resilience of a road transport system—its ability not merely to prevent accidents, but also to protect human life when accidents inevitably occur.
The paradox therefore begins to dissolve.
High pedestrian exposure does not necessarily imply poor road safety.
When supported by lower travelling speeds, rapid emergency response and accessible trauma care, a transport system can accommodate high pedestrian activity while still maintaining comparatively low accident lethality.
Understanding this balance between exposure, survivability, and severity may be the key to developing more meaningful indicators of road safety—not only for Kerala but for India as a whole.
Conclusion: Beyond Counting Deaths
Road safety is often judged by a single question: How many people died? While this measure is indispensable, it does not tell the whole story. The analysis presented in this article suggests that pedestrian safety is far more complex than absolute fatality counts alone.
Kerala presents a striking paradox. It records the lowest absolute number of pedestrian fatalities among the four southern states, yet pedestrians constitute the highest proportion of its road accident victims. At the same time, Kerala consistently reports the lowest Accident Severity Index, indicating that people involved in road accidents are significantly more likely to survive than in neighbouring states.
These three observations do not contradict one another. Rather, they describe different dimensions of the same reality.
The first reflects pedestrian exposure—the extent to which people interact with traffic in their daily lives. Kerala’s continuous urbanisation, ribbon development, mixed land use and walking-oriented neighbourhoods naturally place a larger number of pedestrians on or near roads. Greater exposure inevitably increases pedestrian involvement in road accidents.
The second reflects accident survivability—the ability of a transport system to protect human life after a collision has occurred. The State’s dense network of hospitals, widespread emergency medical services, comparatively shorter access to trauma care, and generally lower operating speeds may together create conditions that improve the chances of survival during the critical minutes following a crash.
The third reflects accident severity—the lethality of road accidents themselves. Kerala’s exceptionally low Accident Severity Index suggests that although accidents continue to occur, they are less likely to result in fatalities than in many other parts of the country.
Taken together, these observations point towards a broader lesson.
A truly safe transport system is not one where nobody walks because the roads are perceived as dangerous. Nor is it one where accident statistics are low simply because pedestrians have disappeared from the streets. A safe transport system is one where people can walk confidently, where accidents are prevented wherever possible, and where those who are injured have the greatest possible chance of survival.
This article proposes that road safety should be viewed through three interconnected lenses—Pedestrian Exposure, Accident Survivability and Accident Severity—forming what may be called the Pedestrian Safety Triangle. Together, these dimensions provide a more comprehensive framework for understanding pedestrian safety than fatality counts alone.
Perhaps the next generation of road safety policies should not ask only “How do we prevent accidents?” They should also ask an equally important question:
“How do we ensure that when accidents happen, more people survive?”
For pedestrians—the most vulnerable users of our roads—that question may ultimately prove to be the most important of all.
Reference: